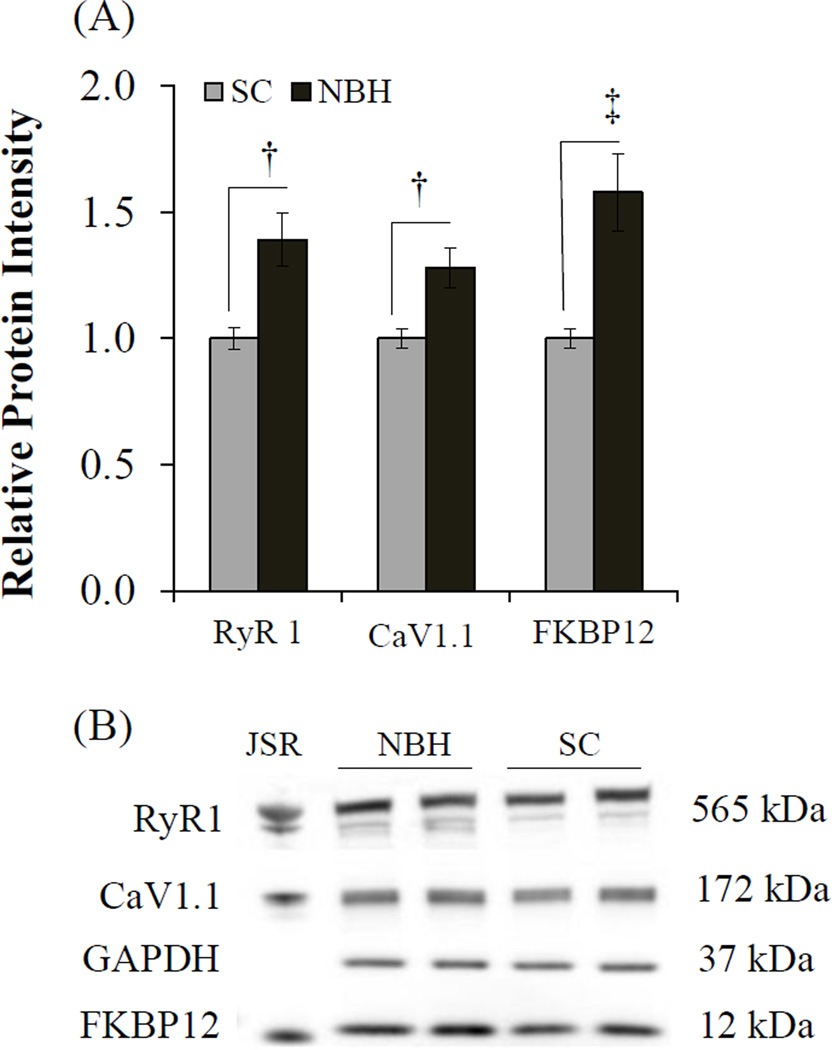
Figure 4.
Differences in RyR1, CaV1.1 and FKBP12 protein levels in the skeletal muscle of killifish from NBH and SC. (A) Average protein band intensity shown as a ratio to SC after normalization to GAPDH. (B) Representative protein separation visualized on 5 gels; JSR, junctional sarcoplasmic reticulum preparation from white skeletal muscle of a New Zealand White Rabbit. Means ± SEM; (n = 4); †p ≤ 0.01,‡ p ≤ 0.001.

