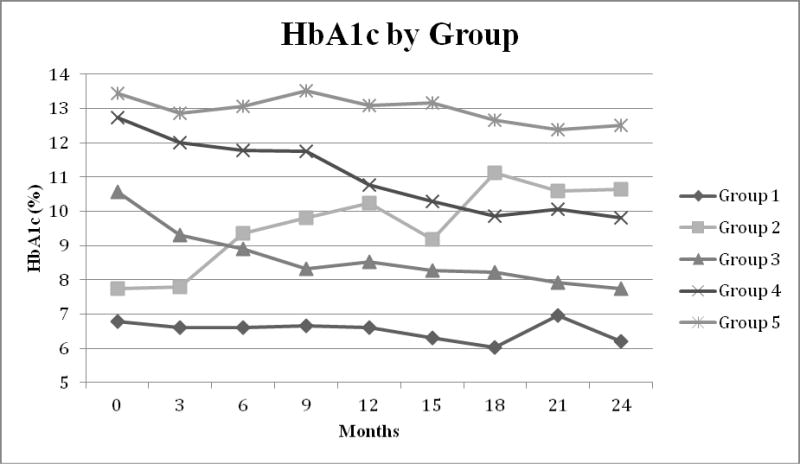
Figure 1.

HbA1c Groups, as identified by trajectory analysis. A total of five different groups were identified. Group 1 N=16 (8.0%), Group 2 N=17 (8.4%), Group 3 N=54 (26.9%), Group 4 N=64 (31.8%), Group 5 N=50 (24.9%).

HbA1c Groups, as identified by trajectory analysis. A total of five different groups were identified. Group 1 N=16 (8.0%), Group 2 N=17 (8.4%), Group 3 N=54 (26.9%), Group 4 N=64 (31.8%), Group 5 N=50 (24.9%).