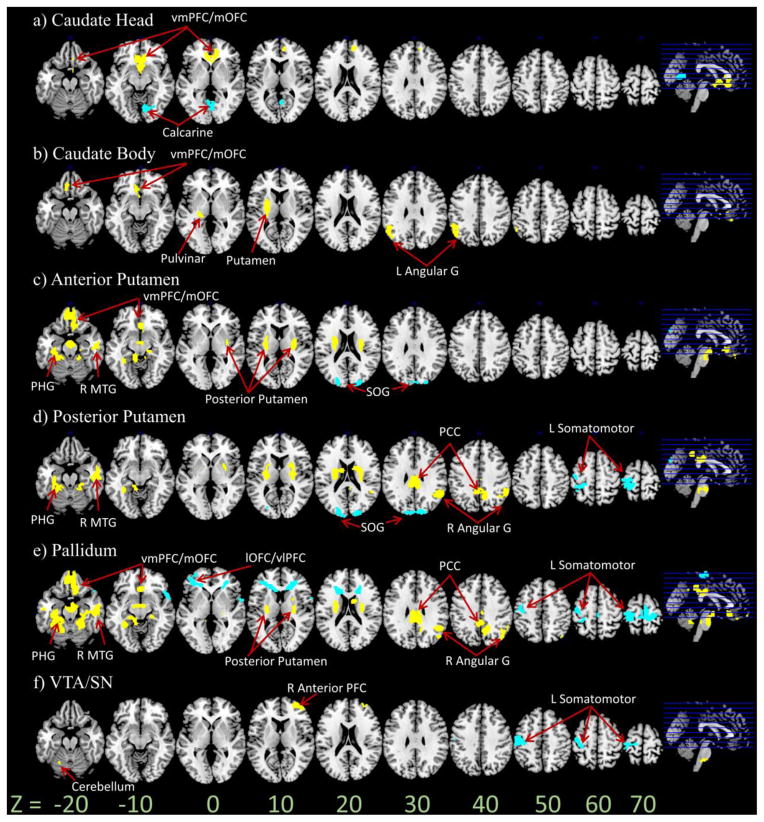
Figure 2.
Age regression on functional connectivity of the a) caudate head b) caudate body c) anterior putamen d) posterior putamen e) pallidum and f) VTA/SN seed regions. p < .001 uncorrected, peak voxel; < . 05 FWE, cluster (cluster size = 10). Yellow and blue color each indicates increases and decreases in functional connectivity with age. R = Right; L = Left; G = Gyrus; vmPFC/mOFC = Ventromedial Prefrontal Cortex/Medial Orbitofrontal Cortex; MTG = Middle Temporal Gyrus; PCC = Posterior Cingulate Cortex; PHG = Parahippocampal Gyrus; lOFC = Lateral Orbitofrontal Cortex; vlPFC = Ventrolateral Prefrontal Cortex; SOG = Superior Occipital Gyrus

