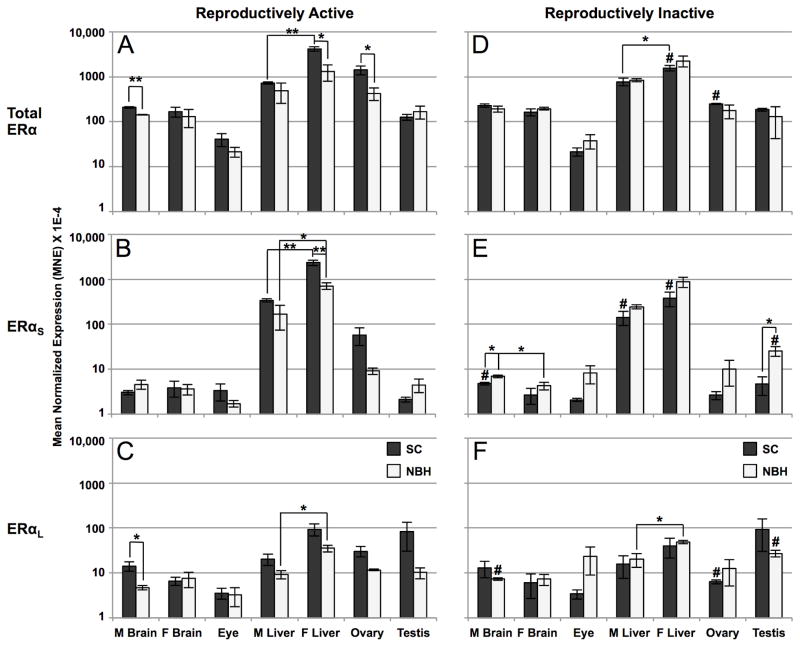
Figure 3. Differential expression of total ERα, ERαS, and ERαL mRNAs by tissue type in reproductively active (A, B, C) and inactive (D, E, F) SC and NBH killifish, as determined by qPCR analysis.
Tissues from SC and NBH killifish of both sexes were pooled by site, sex, reproductive condition and tissue type (2 fish per pool) and analyzed using primers specific for ERαS or ERαL. Additional primers targeted sequence common to both variants (“total” ERα). Results are expressed as mean normalized expression (MNE) +/− SEM of 3 (liver, brain, gonads) or 6 (eye) independent pools per tissue type. Sex-related differences in expression were not significant in the eye, so male and female data were combined. Analysis by log-transformed one-way ANOVA separately for each mRNA species showed significant differences by tissue type (total ERα: F = 45.99, P < 0.001; ERαS: F = 81.14, P < 0.001; ERαL: F = 13.52, P < 0.001). Asterisks indicate a significant difference in expression between sites or by sex at a given site as determined by t-test: *, P < 0.05; **, P < 0.01; ***, P < 0.001. Pound signs indicate a significant difference in expression between reproductively active and inactive fish from the same site as determined by t-test: P < 0.05. Note the logarithmic scale of the y-axis.

