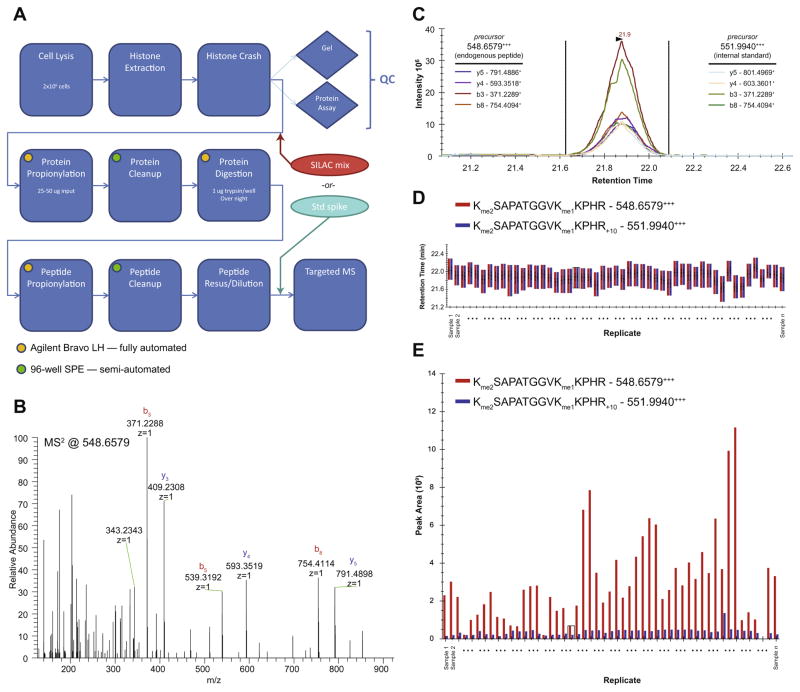
Fig. 1.
Global chromatin profiling targeted proteomics workflow and quality control. (A) Process flow diagram, illustrating points of entry for internal standards and automated steps. In panels (B–E), we follow a peptide corresponding to H3K27me2K36me1 from data acquisition through final ratio determination in a set of samples. Data shown is derived from samples analyzed in Fig. 2A. (B) A single raw MS/MS spectrum targeting a peptide precursor of m/z 548.6579, corresponding to the z = 3 state of the fully derivatized endogenous peptide. (C) Extracted ion chromatograms of MS/MS fragment ions (transitions) for both the endogenous peptide and the internal standard for a single sample in the set (extracted using Skyline). (D) Retention time view of all samples in the set for both the endogenous peptides (red) and internal standards (blue). Consistency illustrates the reproducibility of the chromatographic dimension of the assay. (E) Calculated ion abundances for both the endogenous peptides (red) and internal standards (blue) of all samples in the set, as derived from areas under the curve in (C). Ratios are determined by dividing the ion abundances of the endogenous peptides (red) by the internal standards (blue).

