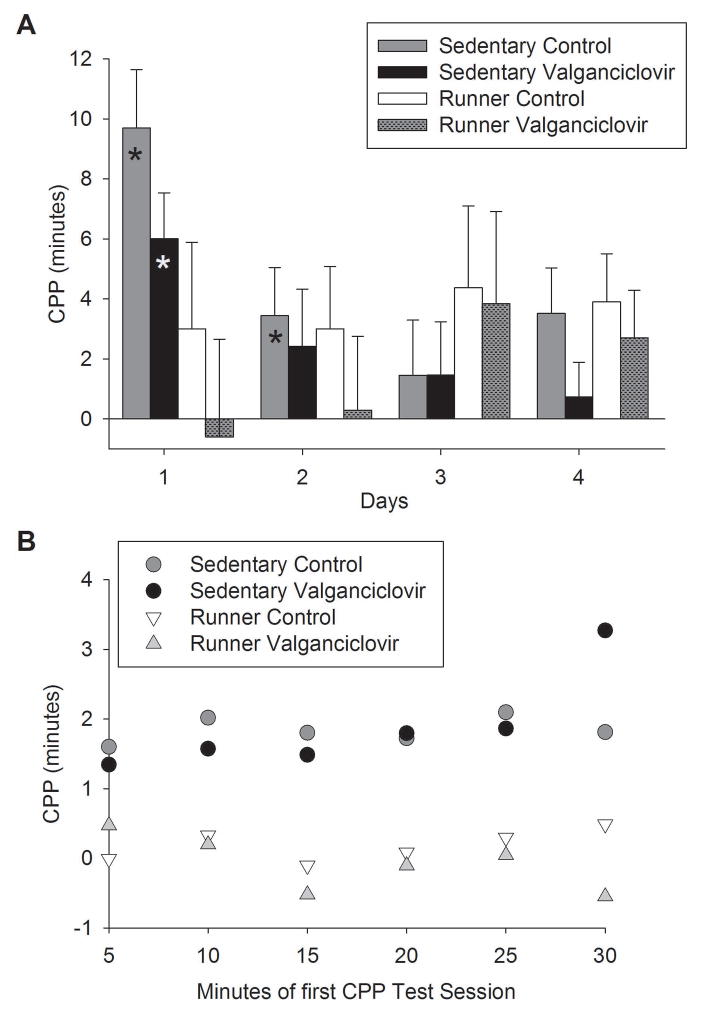
Figure 4.
Conditioned place preference for cocaine during testing. A) Mean difference in duration (min) ± SE spent on the HOLE texture between animals receiving cocaine on HOLE texture (CS+HOLE) and animals receiving cocaine on GRID texture (CS+GRID) plotted separately for sedentary animals and runners receiving control chow or valganciclovir chow. Each bar represents data for the following animals: sedentary mice receiving control chow n = 13 CS+HOLE animals and n = 13 CS+GRID animals, sedentary mice receiving valganciclovir chow n = 10 CS+HOLE animals and n = 10 CS+GRID animals, runner mice receiving control chow n = 9 CS+HOLE animals and n = 9 CS+GRID animals, and runner mice receiving valganciclovir chow n = 10 CS+HOLE animals and n = 8 CS+GRID animals. The stars indicate significant place preference at P<0.05. B) Mean difference in duration (min) ± SE spent on the HOLE texture between animals receiving cocaine on HOLE texture (CS+HOLE) and animals receiving cocaine on GRID texture (CS+GRID) during the first CPP testing session plotted in 5-minute intervals separately for sedentary animals and runners receiving control chow or valganciclovir chow.

