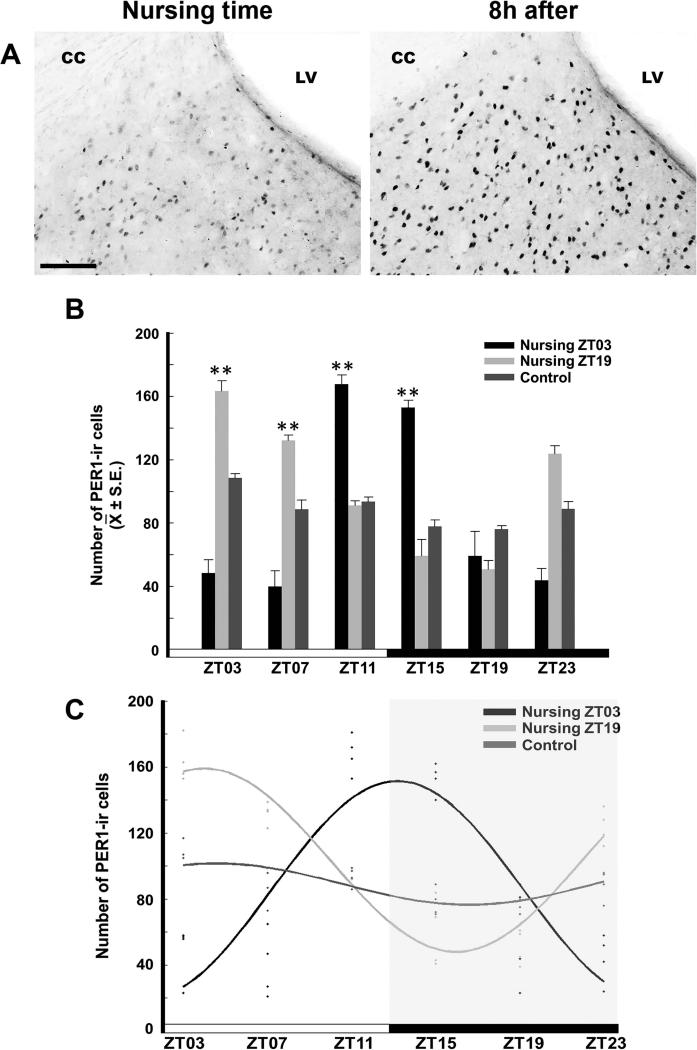
Figure 3.
Expression of PER1 in the LSD. (A) Photomicrographs of representative sections at nursing time and at 8h after nursing in the Nursing ZT03 group. Note the density of PER1-ir cells 8h after nursing. LV, lateral ventricle, CC, corpus callosum. Scale bar 100 μm. (B) PER1-ir cells in Control, Nursing ZT03 and Nursing ZT19 groups; ** Denotes significant difference between higher and lower values within the same group.. ** P < 0.001. Values are mean ± SEM. The black and white bar at bottom represents the LD condition. (C) Cosinor analysis indicates a significant rhythmicity of PER1-ir cells in Nursing ZT03 and Nursing ZT19, but not in Control group. See text for details.

