
Figure 6.
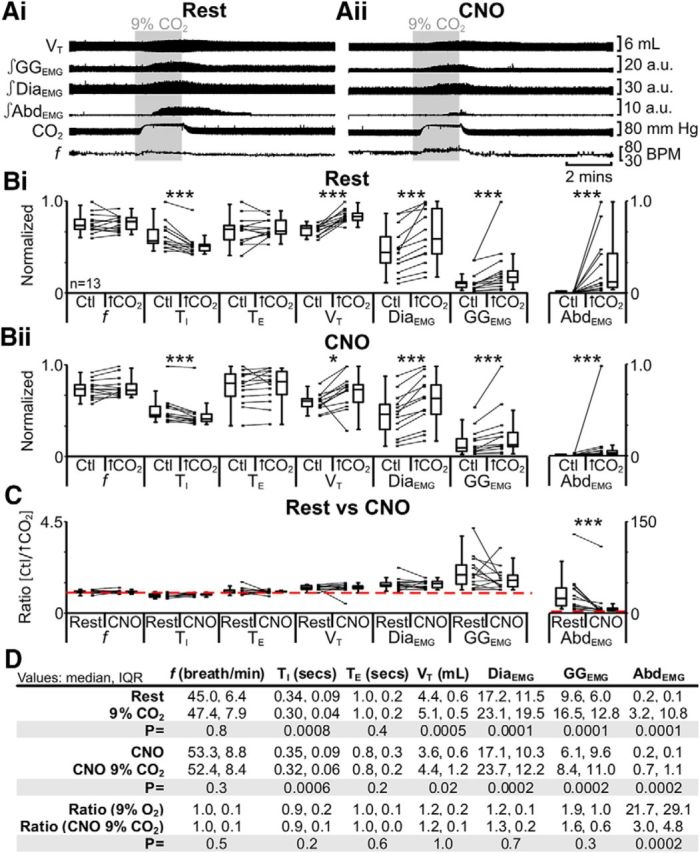
Hyperpolarizing pFL neurons reduced effects of hypercapnia (9% CO2) on AbdEMG only. A, Integrated traces from a single experiment: shaded area shows period of hypercapnia. Ai, Rest. Aii, During application of CNO to medullary surface (present for entire trace). B, Comparison of respiratory variables before and after hypercapnia in pFL:HM4DR rats at rest (Bi) and in the presence of CNO (Bii). Lines connect data from individual experiments, and box-and-whisker plots show combined data. Data in Bi and Bii are normalized to highest value for that parameter, i.e., f, TI, TE, VT, GGEMG, DiaEMG, or AbdEMG, regardless of whether it belonged to control or 9% CO2 group. C, Comparison between ratio changes induced by hypercapnia in pFL:HM4DR rats at rest and in the presence of CNO. Data in C are expressed as ratios of resting values, and red horizontal dashed line represents a ratio of 1. D, Table containing median, IQR, and p values, from data represented in B. *p < 0.05, **p < 0.01, ***p < 0.005.