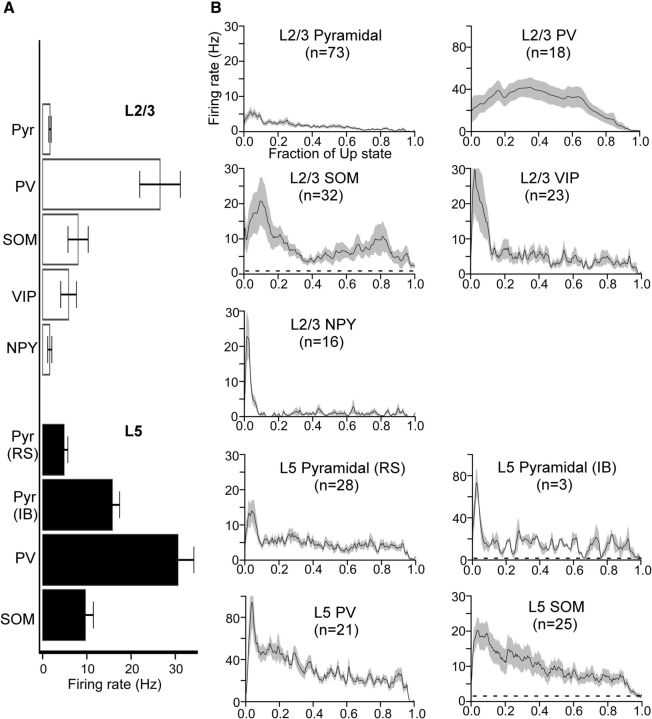
Figure 6.
Firing rates of pyramidal cells and interneurons during Up states A, Mean total firing rates of pyramidal cells and interneurons. Error bars indicate SEM. B, Mean time-dependent firing rates of pyramidal cells and interneurons. Firing rates are plotted as a function of the fraction of the Up state (i.e., the time axis is normalized from 0 to 1 to average across recordings with different Up-state durations). Dashed lines underneath waveforms for SOM cells and L5 IB pyramidal cells indicate mean Down state firing rates (Down state firing rates for all other cell types are zero). Note the different firing-rate axis for PV cells and L5 IB cells. Shading represents SEM. The following comparisons were significant (Kruskal–Wallis test, Bonferroni correction): RL5 Pyr, RS > RL2/3 Pyr (p = 7.6 × 10⁻⁵), RL5 Pyr, RS < RL5 PV (p = 8.8 × 10⁻¹¹), RL5 Pyr, RS < RL2/3 PV (p = 2.3 × 10⁻⁴), RL5 Pyr, RS > RL2/3 NPY (p = 0.032), RL2/3 Pyr < RL5 PV (p = 2.5 × 10⁻¹⁵), RL2/3 Pyr < RL2/3 PV (p = 8.5 × 10⁻⁸), RL2/3 Pyr < RL5 SOM (p = 1.1 × 10⁻⁶), RL2/3 Pyr < RL2/3 SOM (p = 4.1 × 10⁻⁷), RL5 PV > RL5 SOM (p = 9.3 × 10⁻⁶), RL5 PV > RL2/3 SOM (p = 1.2 × 10⁻⁸), RL5 PV > RL2/3 VIP (p = 6.9 × 10⁻⁸), RL5 PV > RL2/3 NPY (p = 6.7 × 10⁻¹⁰), RL2/3 PV > RL5 SOM (p = 0.038), RL2/3 PV > RL2/3 SOM (p = 0.0011), RL2/3 PV > RL2/3 VIP (p = 0.0036), RL2/3 PV > RL2/3 NPY (p = 2.0 × 10⁻⁴), RL5 SOM > RL2/3 NPY (p = 0.0019), RL2/3 SOM > RL2/3 NPY (p = 0.0060).

