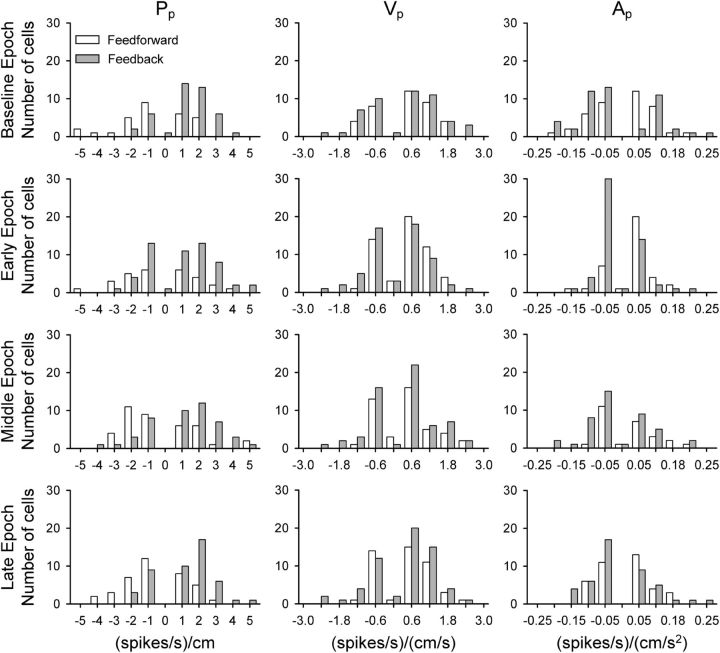
Figure 12.
Distribution of β values. Histograms show the distribution of β values resulting from regression analyses. Values are grouped by FF (white) or FB (gray) peak τ values and the model parameters Pp, Vp, and Ap (columns). Results are shown for the task epochs of baseline and late adaptation (rows).

