
Figure 2.
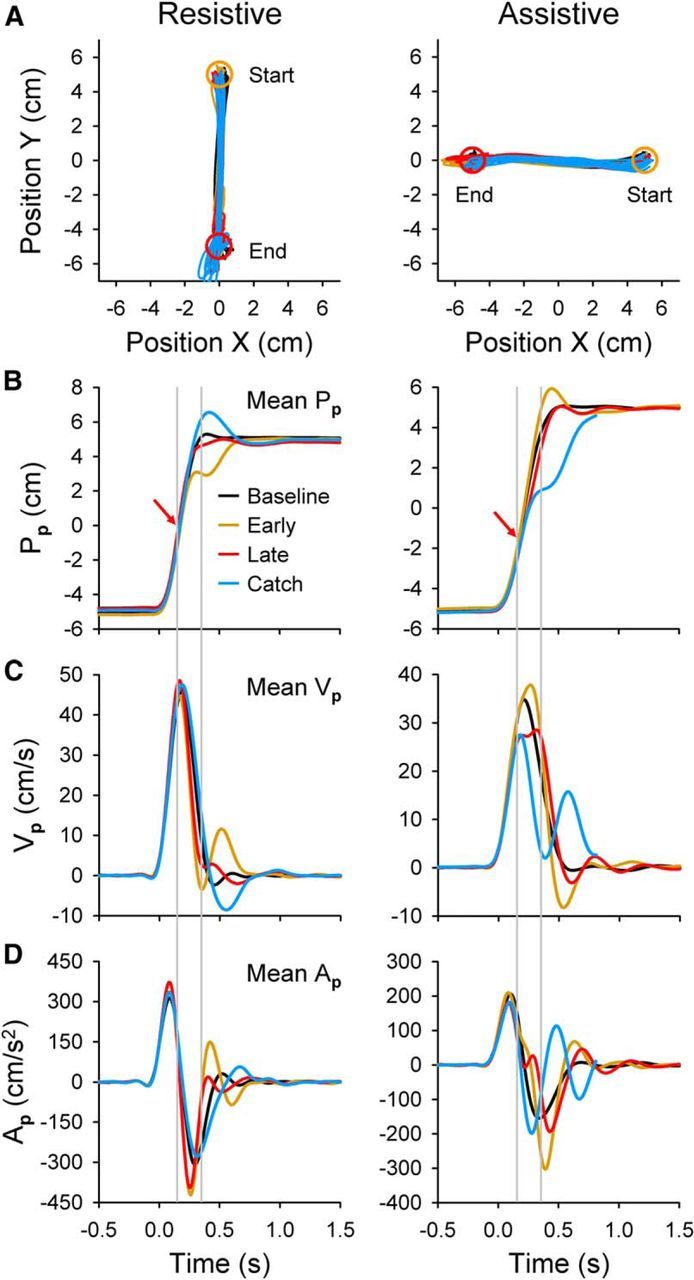
Hand movement kinematics, parallel. A, Actual hand-position coordinates (X, Y) from baseline error-clamp (black), early-adapt (gold), late-adapt (red), and catch (blue) trials for example resistive (Monkey I, left column) and assistive (Monkey N, right column) recording sessions. Note that 1.5 cm start (yellow circle) and end (red circle) targets centered at +5 and −5 cm produce a position workspace span of −5.75 to 5.75 cm. Position data cover the entire trial duration, including hold periods. B, Mean parallel hand position (Pp) trajectories were plotted versus time for the same trials. Red arrows depict the perturbation start position. Gray lines show approximate perturbation start and end times. C, D, Mean hand velocity (Vp) and acceleration (Ap) traces are shown. In all plots, data represent 10 trials from each condition except for catch trials (n = 7 resistive, n = 12 assistive). Perturbation parameters and PDs were as follows: resistive M = −9 N, D = 200 ms, p = 50% (i.e., center of the reach), 270°; assistive M = +7 N, D = 200 ms, p = 35%, 180°.