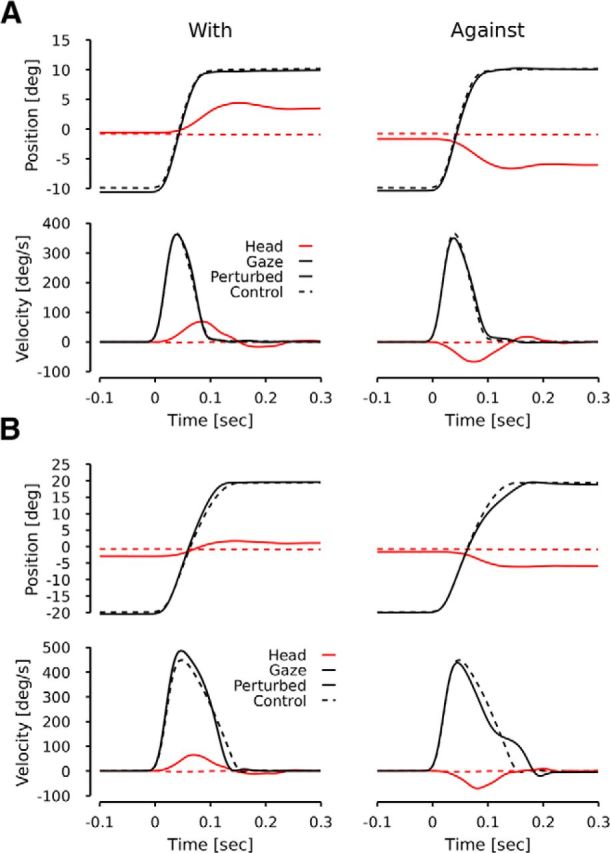
Figure 1.

Typical examples. A, A typical case for a 20° (40°, B) target jump for S1. In both panels, the top row represents the time course of position signals (red lines for head, black lines for gaze). The bottom row represents the time course of velocity signals. Dashed lines represent the control condition. Solid lines represent the perturbed condition. Left (right) column represents perturbed cases when the chair moved with (against) the gaze movement.
