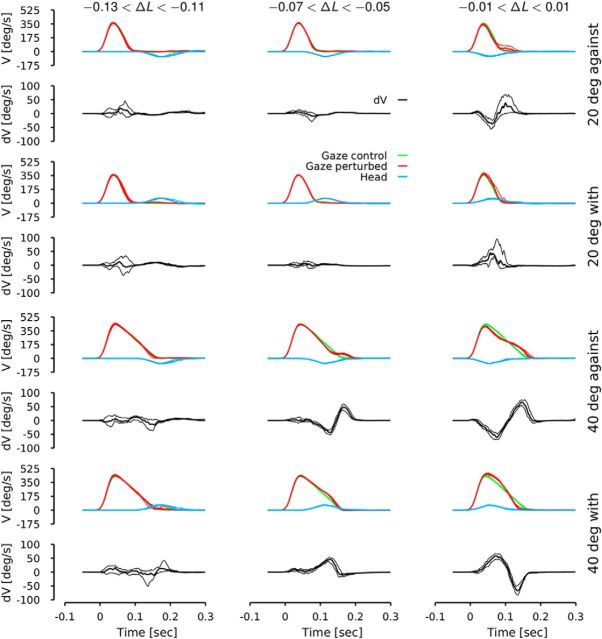
Figure 2.
Averaged velocity (V) trajectories as a function of the relative chair latency (ΔL), the direction of the perturbation and the amplitude of the target jump. ΔL is the difference between gaze onset and head onset. Green lines represent the control gaze velocity. Red lines represent the perturbed gaze velocity. Cyan lines represent the chair velocity. Black lines represent the difference between the control and the perturbed gaze velocity (dV). Thick lines represent the median of the different signals and thin lines represent the 95% confidence interval of the median of each signal. Behavior is shown when the target jump was equal to 20° (top four rows) and 40° (bottom row), and the chair moved with or against the gaze movement. All data from all subjects were pooled.

