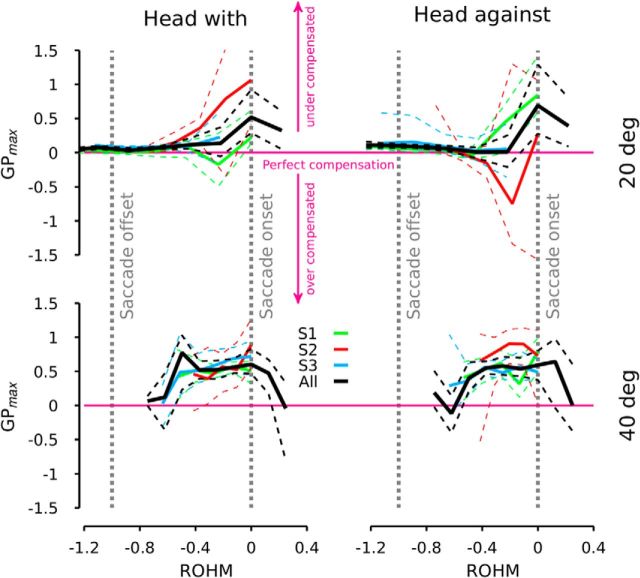
Figure 3.
Gain, GPmax, at the peak velocity of the perturbation as a function of the ROHM for different subjects. The top row shows the evolution of GPmax for 20 (40°, bottom) target jumps, all latencies pooled together (50 ms < latency < 300 ms). Thick solid black lines represent the average of GPmax for all the subjects pooled together. Thick solid colored lines represent the average of GPmax for each subject. Dashed lines represent the 95% confidence interval of the different averaged GPmax. The vertical dashed gray lines represent the onset (right line) and the offset (left line) of the saccade.

