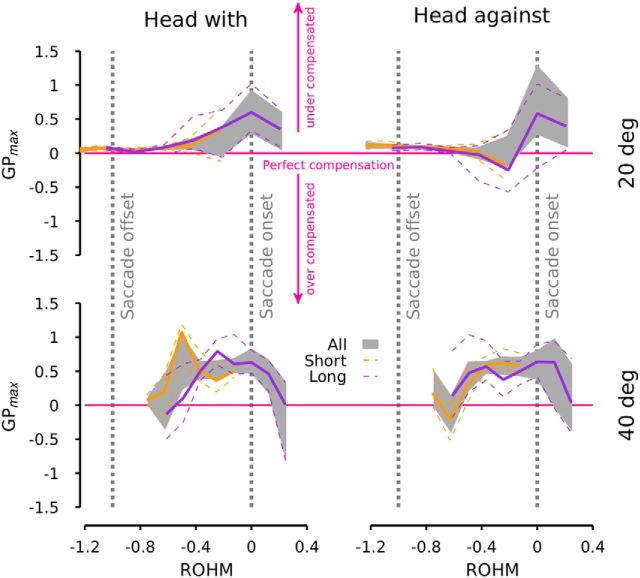
Figure 4.
Gain GPmax at the peak velocity of the perturbation as a function of the ROHM for different saccade latencies. Same layout as in Figure 3. The gray area represents the 95% confidence interval of GPmax for all latencies pooled together. Solid orange lines represent the average of GPmax for saccade latencies shorter than 110 ms. Solid purple lines represent the average of GPmax for saccade latencies larger than 110 ms. Dashed lines represent the 95% confidence interval of the different averaged GPmax.

