Figure 4.
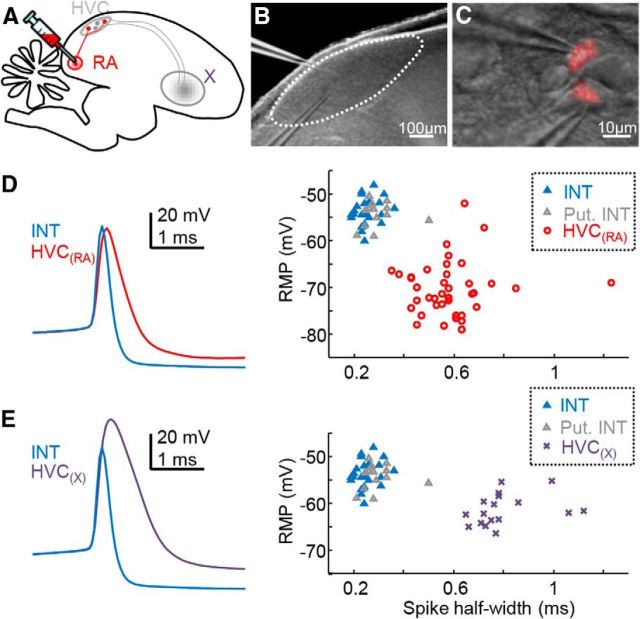
Classification of HVC cell types in vitro. A, Schematized parasagittal section through the zebra finch brain, showing a retrograde dye injection into nucleus RA and Area X to label HVC(RA) and HVC(X) neurons, respectively. B, Dodt contrast image of HVC in the slice (HVC perimeter represented with a dashed line). C, Individual, DiI-labeled HVC(RA) neurons visualized with a 40× objective (red overlay of fluorescence image) and targeted with whole-cell patch pipettes. D, HVC interneurons frequently formed inhibitory synaptic connections onto nearby cells (see Fig. 5 for an example), confirming their identity (blue triangles, n = 22 pairs). Otherwise, putative HVC interneurons (gray triangles, n = 13 cells) were classified based on their intrinsic properties, namely spike waveform (overlay on left) and RMP, which were distinct from a set of retrogradely labeled HVC(RA) neurons (n = 39 cells). E, Putative HVC interneurons were also separable from a set of retrogradely labeled HVC(X) neurons (n = 17 cells). On average, the RMP of HVC(RA) neurons, HVC(X) neurons, and HVC interneurons were −70.37 ± 5.70 mV, −61.35 ± 3.27 mV, and −53.97 ± 2.80 mV, respectively. Spike half-width of these three major HVC cell classes were also different across these groups (HVC(RA): 0.58 ± 0.15 ms, HVC(X): 0.80 ± 0.13 ms, interneuron: 0.27 ± 0.06 ms).

