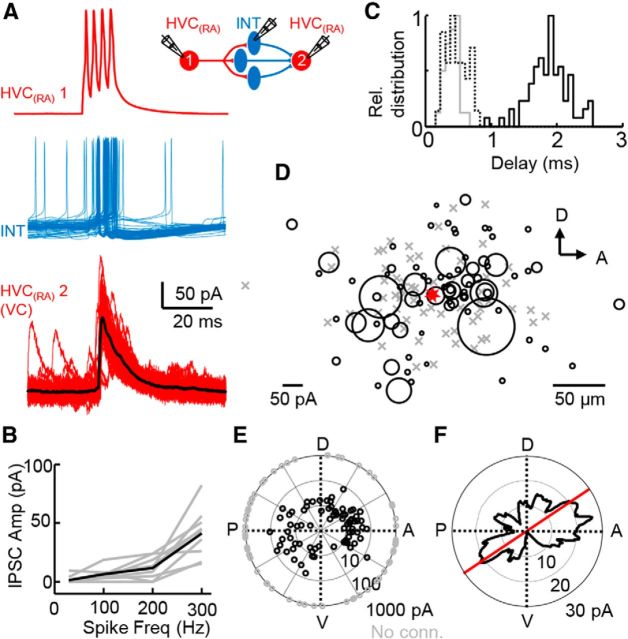
Figure 6.
Prominent disynaptic inhibition between HVC(RA) neurons. A, Schematic and recording of two HVC(RA) neurons and an intermediate interneuron. An evoked high-frequency burst (4 spikes at 300 Hz) in one HVC(RA) neuron typically elicits an action potential in an interneuron (RMP = −54.4 mV) and subsequent inhibitory responses in another HVC(RA) cell. B, HVC(RA) neuron pairs often exhibit frequency-dependent disynaptic inhibition quantified across a population of 9 pairs (average in black). C, Distribution of delay times for all connections (disynaptic HVC(RA)→HVC(RA), black line; monosynaptic HVC(RA)→interneuron, dotted line; monosynaptic interneuron→HVC(RA) connections, gray line). D, HVC(RA)→HVC(RA) disynaptic inhibitory connections plotted with respect to their position in the parasagittal plane (red is presynaptic cell; size of black circles show strength of inhibitory connection; gray Xs are not connected). E, HVC(RA) → HVC(RA) disynaptic IPSC strengths (n = 140 pairs) also plotted with their relative directionality within HVC. We sampled uniformly from all angular positions in the parasagittal plane of HVC (p = 0.428, Rayleigh test). F, Smoothed average of IPSC strength values from C, including nonconnected as 0 pA strength (see Materials and Methods for details). Red line (34° ventral deviation from anterior → posterior axis of HVC) shows the largest bimodal bias of disynaptic IPSC strength coupling between pairs of HVC(RA) neurons.

