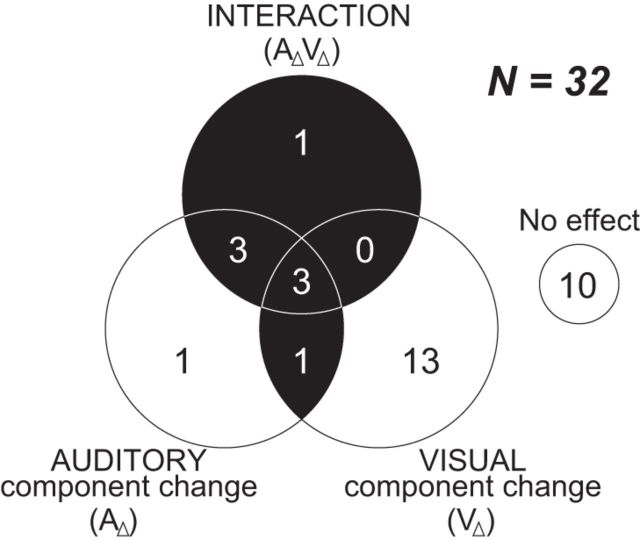
Figure 10.
Summary of neuronal responses to the component change(s) during the nonmatch period. The neurons with an effect of the nonmatch type are grouped by the result of the regression analysis (Eq. 4). AΔ indicates the change of the auditory component between the sample and the test stimulus (A1→A2 or A2→A1) and VΔ indicates the change of the visual component (V1→V2 or V2→V1). AΔVΔ is the interaction. The black area indicates multisensory component change neurons that had significant main effects of both AΔ and VΔ, or a significant interaction effect.

