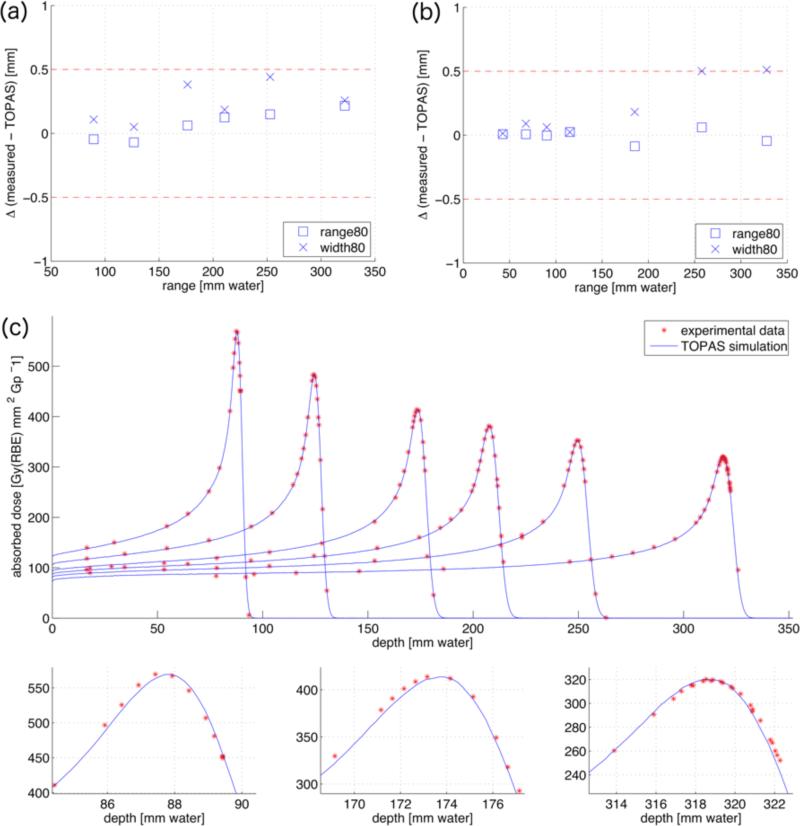
Figure 5.
Differences in range80 (squares) and width80 (crosses) in mm between the Monte Carlo simulations and the measured depth dose distributions for different ranges for MGH (a) and PSI (b), respectively. (c): Monte Carlo simulations (blue lines) compared with measurements (red stars) for the calibration dataset from MGH. The simulations are plotted in units of Gy(RBE) mm2 Gp−1, the measurements are normalized to the maximum dose. The lower part shows magnifications of the first, third and sixth peak.

