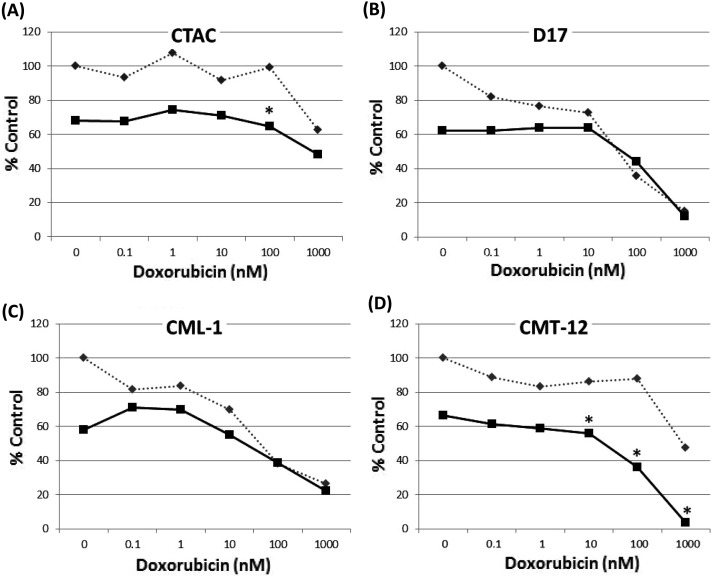
Fig. 4.
Doxorubicin alone is represented by the interrupted line, while the combination of doxorubicin and loperamide is represented by the non-interrupted line. Concentrations that exhibit synergism are represented by the *. Loperamide concentration in A-C is 10 µM, while it is 25 µM in D. The curves are representative samples of experiments performed in triplicate.

