Fig. 1.

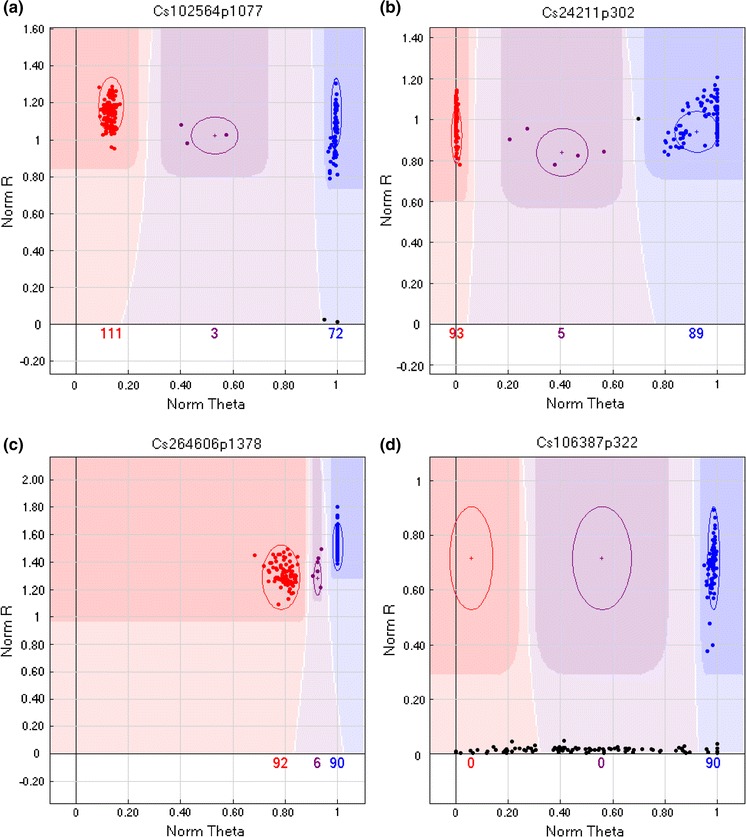
GenomeStudio images of SNP markers segregating in the RIL Population. a SNP showing typical 3 cluster segregation pattern; b SNP where the hybridization of one allele was affected perhaps by the presence of an additional SNP in the flanking sequence; c SNP with extremely low cluster separation, requiring manual editing of the clusters; and d dominant SNP for which only one allele could be scored
