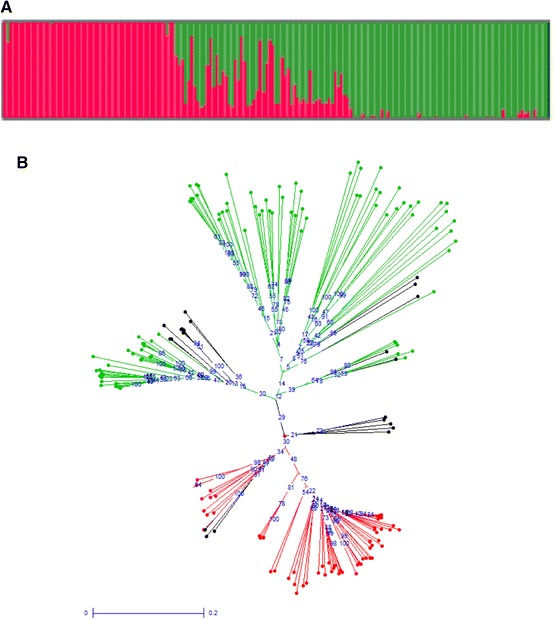
Fig. 3.

Patterns of molecular variation in 175 C. sativa accessions. a STRUCTURE analyses showing population membership of each line (y-axis) based on Q value (x-axis) indicated in red (population 1) and green (population 2). b Phylogenetic relationship among 175 C. sativa accessions based on the unweighted neighbour joining method. (Color figure online)
