Fig. 5.

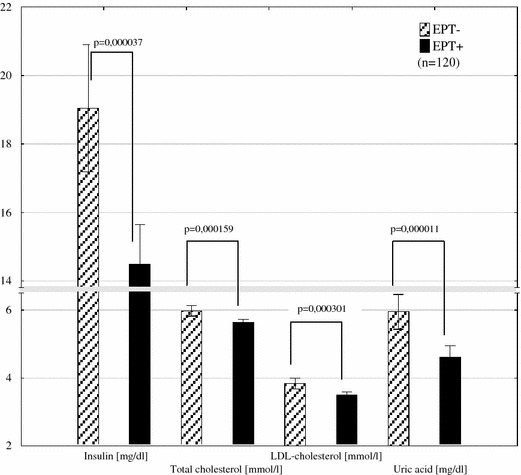
The comparison of plasma levels of insulin, total cholesterol, LDL cholesterol, uric acid between women treated with (n = 60) or without EPT (n = 60) (EPT estrogen plus progestin therapy)

The comparison of plasma levels of insulin, total cholesterol, LDL cholesterol, uric acid between women treated with (n = 60) or without EPT (n = 60) (EPT estrogen plus progestin therapy)