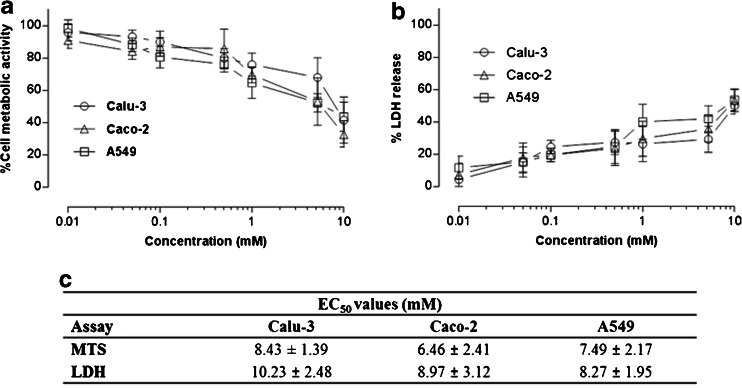
Fig. 3.
Effect of Solutol® HS15 on Calu-3, Caco-2 and A549 cells assessed by metabolic activity (a) and LDH assays (b). Solutol® HS15 was used at concentrations above and below the Critical Micelle Concentration (Fig. 2). Data expressed as relative metabolic activity and presented as the mean ± SD with N = 3 and n = 4. Data to summarize Solutol® HS15 concentrations that cause 50% reduction in cell viability (EC50, mM) and LDH leakage in tested cell lines shown in table (c). Statistical analysis: MTS assay, EC50 P values: Calu-3 to Caco-2 < 0.05, Caco-2 to A549 > 0.05 and Calu-3 to A459 > 0.05. LDH assay EC50 P values; Calu-3 to Caco-2 < 0.05, Caco-2 to A549 > 0.05 and Calu-3 to A459 < 0.05 conducted using t-test. Overall statistical difference between each test conducted for MTS and LDH P value < 0.05, conducted using one-way ANOVA.

