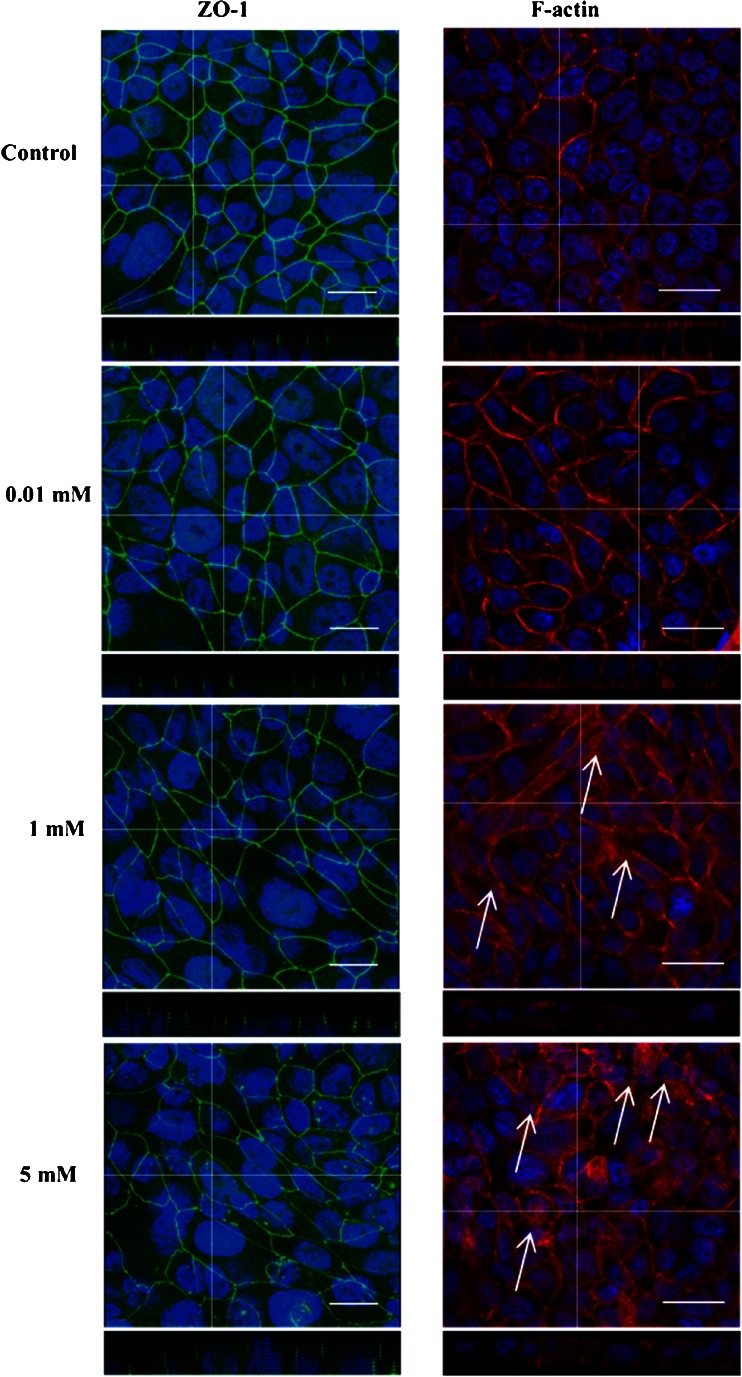
Fig. 5.
Confocal micrographs with XZ stack showing distribution of junctional complex protein ZO-1 (left) and F-actin morphology (right) distribution in polarized Calu-3 monolayers following application of Solutol® HS15. White arrows highlight changes in F-actin distribution following Solutol® HS15 application. ZO-1 (green) was immunostained with mouse, anti-human ZO-1 (primary) antibody then with FITC-labelled goat, anti-mouse (secondary) antibody. F-actin was immunostained with Alexafluor 546-labelled phalloidin (red) and nuclei blue. Scale bar represents 25 μm and ‘cross hair’ represents region for Z stack analysis. ImageJ (1.47 K) image software was used to create the overlay images from raw series images.

