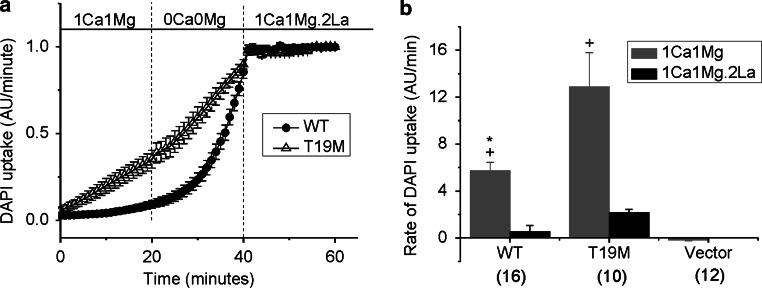
Fig. 4.
The rate of DAPI uptake is increased by lowering divalent cations and inhibited by La3+. Average time course of DAPI uptake by transfected HeLa cells in control solution (1 mM Ca2+, 1 mM Mg2+), in external solutions with no added divalent cations and in control solution plus 200 µM La3+. a Wild-type rat Cx46 (closed circles); T19M (open triangles). To measure changes in the rate of dye uptake over time, the mean DAPI fluorescence intensity per pixel from ROI’s located in the nuclei of Zaza-green positive cells were normalized to mean DAPI fluorescence intensity of the ROI’s at 60 min, averaged and plotted as a function of time. The cells were initially bathed in control solution (containing 1 mM Ca2+, 1 mM Mg2+). Then, the cells were exposed to a solution containing no added divalent cations followed by reperfusion with control solution containing 200 μM La3+. All the solutions contained 4 μM DAPI. b Bar graph shows the rates of DAPI uptake in cells expressing wild-type Cx46, T19M, or vector alone in the presence of 1 mM Ca2+, 1 mM Mg2+ (gray bar); or 1 mM Ca2+, 1 mM Mg2+, 0.2 mM La3+ (black bar). Data are presented as the mean ± SEM. *p < 0.002 (Mann–Whitney rank sum test compared with T19M-transfected cells); + p < 0.001 (Mann–Whitney rank sum test compared with vector-transfected cells). The number of cells analyzed is indicated within parentheses

