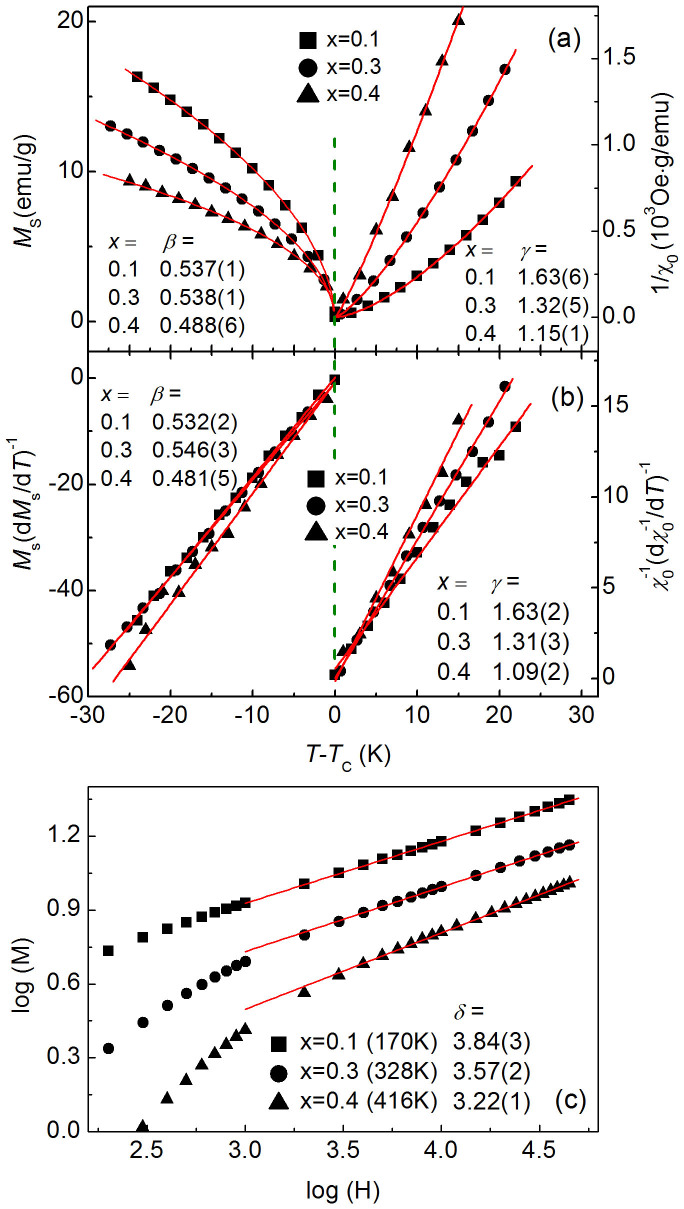
Figure 2. Critical behavior analysis for Cu1-xNMn3+x (x = 0.1, 0.3 and 0.4).
(a) The spontaneous magnetization Ms (left) and inverse initial magnetic susceptibility 1/χ0 (right) vs. (T-TC) along with the fit (solid lines) to the power laws (see the text for details). The obtained critical exponents (β, γ) are shown. (b) The Kouvel-Fisher plot of Ms (left) and 1/χ0 (right) as a function of T-TC. The solid lines represent the linear fitting of the data. The obtained critical exponents (β, γ) are shown. (c) Critical isotherm M(H) on log-log scale at the temperature closest to TC for Cu1-xNMn3+x (x = 0.1, 0.3 and 0.4). The solid lines are linear fits, and the obtained critical exponent δ is shown for each sample.

