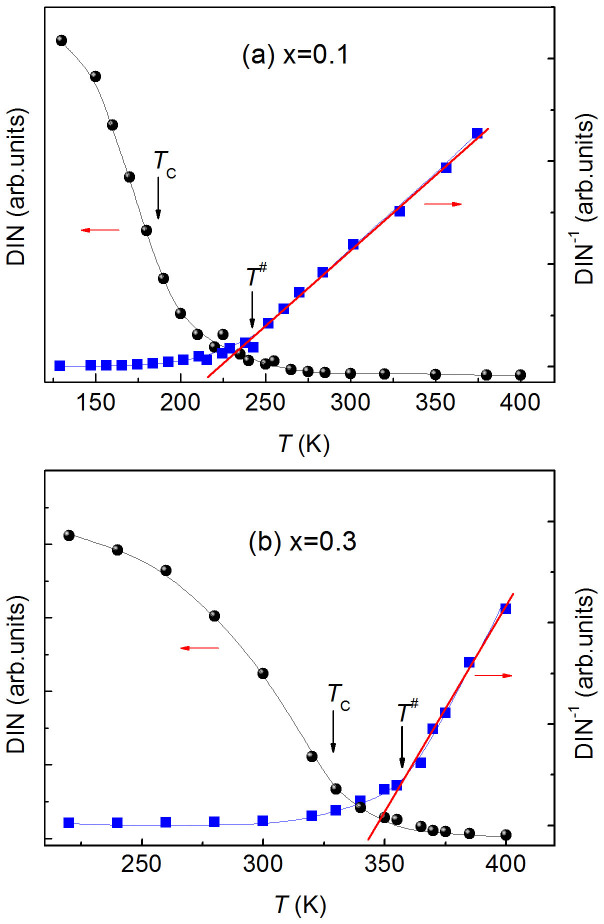
Figure 4. Double integrated intensity (DIN) of the original ESR spectra for Cu1-xNMn3+x.
(a) for x = 0.1 and (b) for x = 0.3. The inverse DIN is also shown in each panel. The solid line (red) on DIN−1(T) curve indicates a linear fit. The temperatures (T#s) at which DIN−1 departs from the linear dependence on temperature and the Curie temperature TC are indicated by the arrows.

