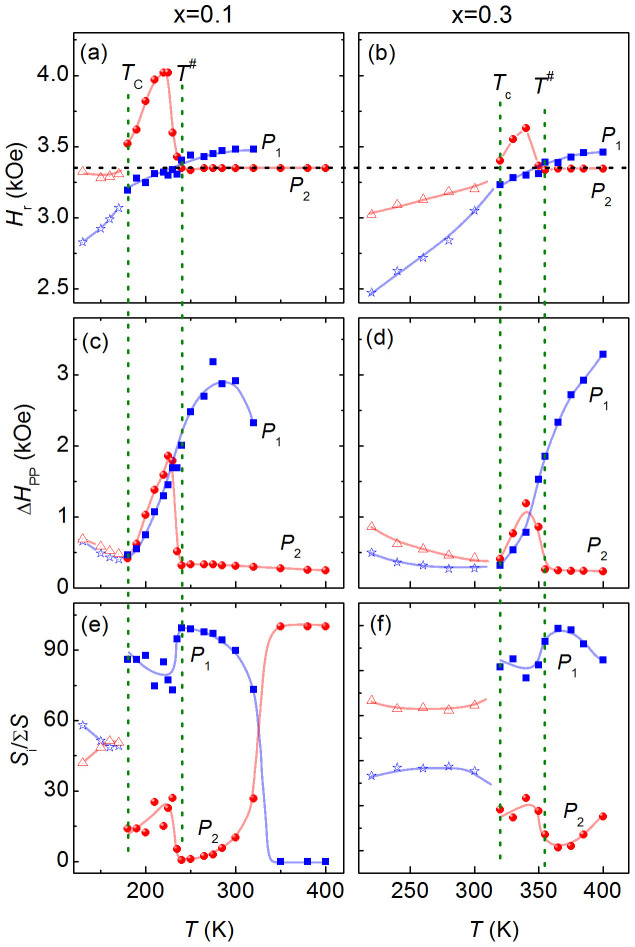
Figure 5. Temperature dependence of the fit parameters, i.e., the resonant field (Hr), peak-to-peak distance (ΔHPP) and intensity ratio of each peak to the total intensity (Si/ΣS) of the ESR spectra for Cu1-xNMn3+x.
(a) Hr for x = 0.1. (b) Hr for x = 0.3. (c) ΔHPP for x = 0.1. (d) ΔHPP for x = 0.3. (e) Si/ΣS for x = 0.1. (f) Si/ΣS for x = 0.3. The temperatures TC and T# are indicated by the vertical dotted lines. The solid lines are guides to the eyes. P1 and P2 refer to the resonant peaks above TC.

