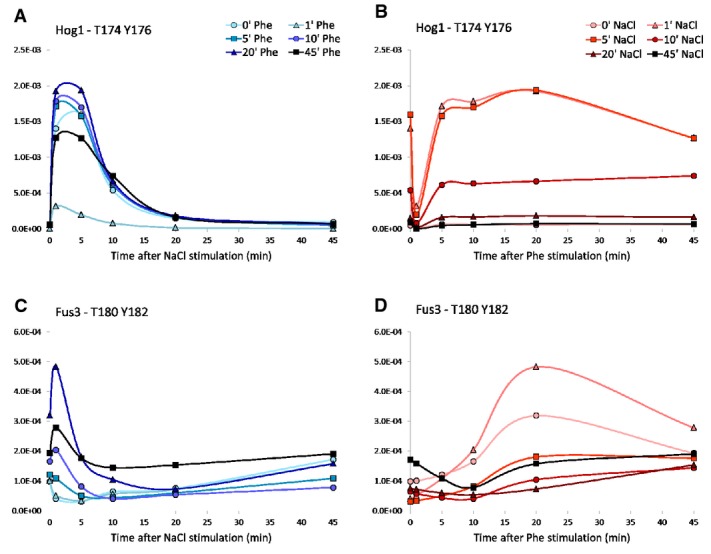
Figure 5.
Hog1 and Fus3 activation sites
- A–D The 2-dimensional dynamic curves (see Fig3C) of the doubly phosphorylated forms of the activation peptides of the Hog1 and Fus3 MAP kinases: Hog1_T174_Y176 (A, B) and Fus3_T180_Y182 (C, D). Missing values were estimated by cubic spline data interpolation (see Supplementary Table S1 for all details).