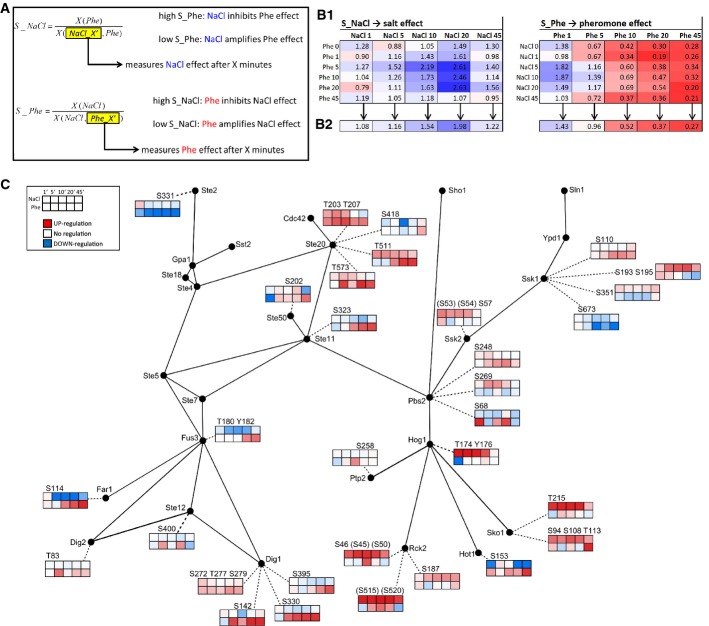
Figure 6.
Quantification of the NaCl- and the pheromone-induced influence on each phosphopeptide
- Implementation of the specificity measure (Schaber et al, 2006) for the quantification of the NaCl- and the pheromone-induced effects over the HOG and pheromone pathway phosphopeptides (P-peps). We named the resulting specificity measures S_NaCl and S_Phe, respectively.
- For each P-pep, we computed both the matrix (B.1) and the vector (B.2) of both S_NaCl and S_Phe. Each value of the matrix was computed as explained in (A). Each value of a vector corresponds to the average of the values of the corresponding matrix taken column-wise: Each value of the vector S_NaCl, for instance, is the average of all the matrix values corresponding to a single time after NaCl stimulation.
- Representation of the most significant specificity vectors for the HOG and pheromone pathways. On top, S_NaCl is shown, and on the bottom S_Phe.

