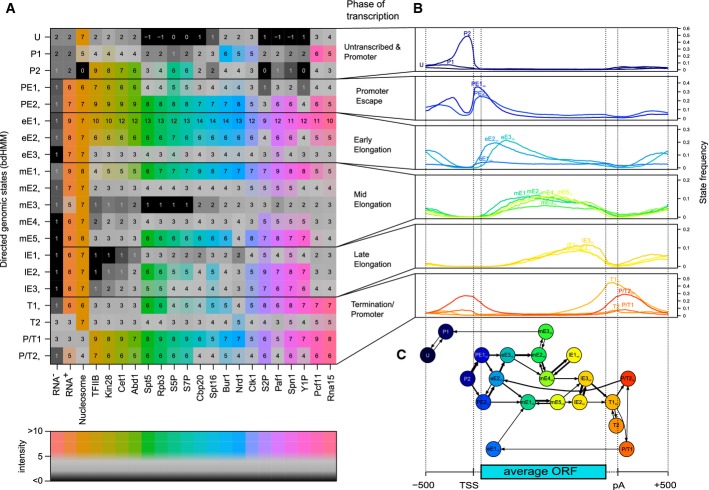
Figure 4.
Roles of directed genomic states in the transcription cycle.
- Mean ChIP enrichment of factors (horizontal axis) indicates the composition of the transcription machinery in each state (vertical axis). Factors were ordered by hierarchical clustering, and states were ordered by position of their most frequent occurrence along the average gene.
- Each state was assigned to a phase in the transcription cycle by investigating the frequency (y-axis) of each state at an average transcript. This spatial state distribution was calculated from the genomic sate sequences (viterbi paths) of 4,362 genes.
- The flux diagram shows probabilities of state transitions calculated from the viterbi paths. Branches mark alternative successions of states at individual genes and thus reveal extensive variation in the transcription cycle as it is modeled by the genomic states. Each node (state) is positioned according to the most frequent position on a metagene. The diagram contains at least one incoming and one outgoing transition for each state as well as transitions observed with a frequency > 0.01 on the metagene.

