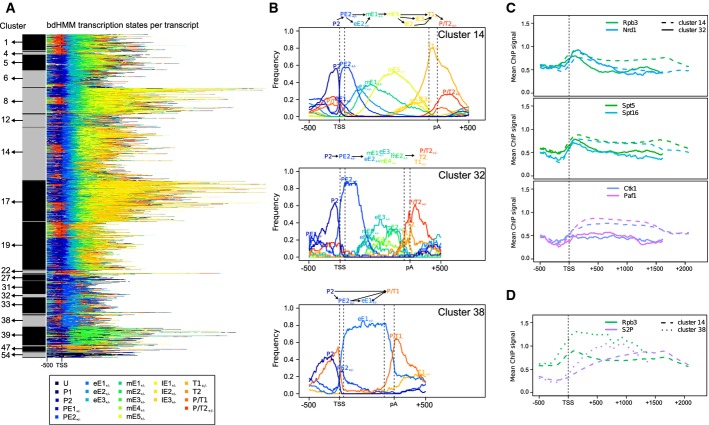
Figure 5.
Clustering of state paths reveals gene-specific variations in the transcription cycle.
- Genomic state sequences of 4,632 genes were clustered into 55 groups (left, only clusters containing at least 20 genes are labeled). Each line corresponds to the state sequence of a single gene. States are colored as shown in the legend.
- Clusters exhibit distinct state frequency distributions and transition patterns (shown as schematic flux diagrams on top of panels). Cluster 14 shows a transcription cycle closest to the canonical one proposed by Mayer et al (2010). Genomic state sequences of clusters 32 and 38 differ from the canonical one, indicating variations in the transcription cycle.
- Clusters 14 and 32 exhibit distinct recruitment of factors to genes. PolII subunit Rpb3, Nrd1, Spt5 and Spt16 binding is very similar in the beginning of genes, but decreases much more strongly in cluster 32 throughout the transcripts. Ctk1 and Paf1 are depleted at cluster 32, but not at cluster 14 genes.
- Cluster 14 shows the canonical Pol II (Rpb3) peak in the 5' region of genes, but Pol II reaches a stable, high level downstream of the TSS in cluster 38. This may suggest a lack of the mechanism for Pol II peaking observed in cluster 14. The steep increase of serine 2 phophorylation in cluster 38 might indicate that productive elongation is reached earlier at those genes.

