
Figure 2. Candidate genes from sequencing screens.
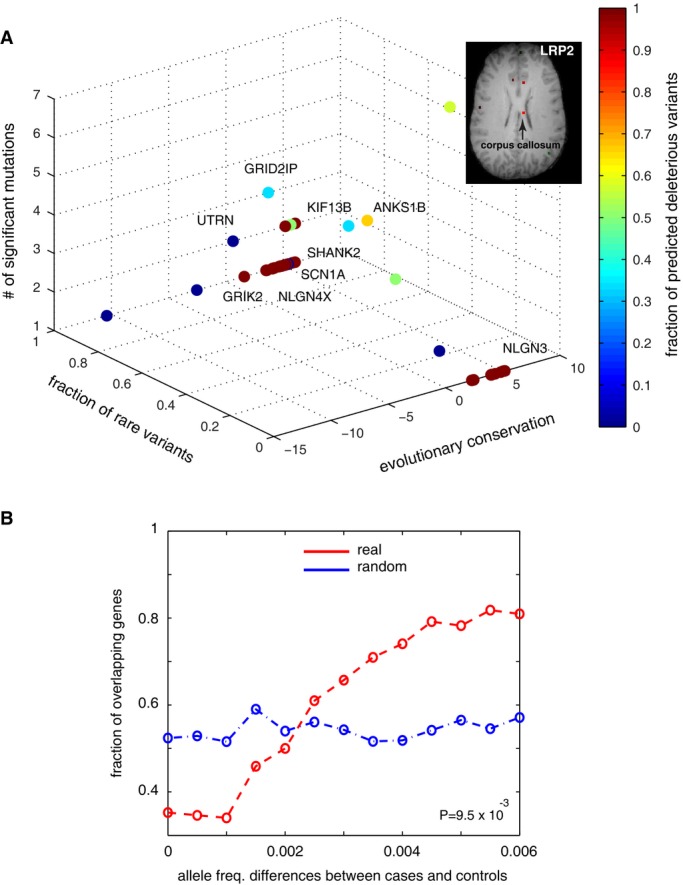
- An overview of the identified loci from whole-genome and exome sequencing. Evolutionary conservation is quantified by GERP++ score, where the higher scores indicate greater selective pressure on the genomic loci. For genes with multiple significant loci, the most conserved residue is considered. Variants absent in the 1,000 Genome dataset are considered rare variants. The genes were colorized based on the fraction of deleterious mutations predicted by MutationTaster among all the identified mutations in the gene (MRI image of the corpus callosum: Allen Institute of Brain Science).
- Validation using another larger patient cohort. In this dataset, variants with allele frequencies with increased absolute differences between cases and controls are more likely to affect genes that were also detected in our study (red line). The allele frequency difference is the absolute difference between cases and controls. This trend cannot be observed by 10,000 simulations (blue line for one randomized dataset).