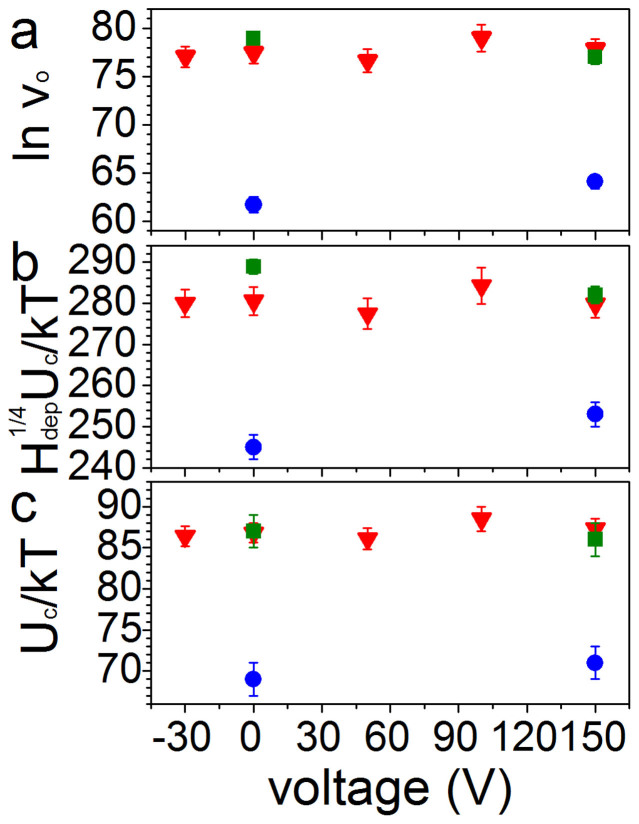
Figure 5.
(a) The values of the intercepts with the ln v axis extracted from fits of the creep law (Equation 1) to the data in Figures 3b and 3c plotted against the voltage applied to the transducers. (b) Gradients of the fits of the creep law to data in Figure 3b and 3c plotted against the voltage applied to the transducers. (c) Ratio of the pinning energy to thermal energy kT obtained by assuming Hdep = Hc. Red triangles represent Pt/Co(t)/Pt t = 1 nm, green squares are t = 0.95 nm and blue circles are t = 0.85 nm.

