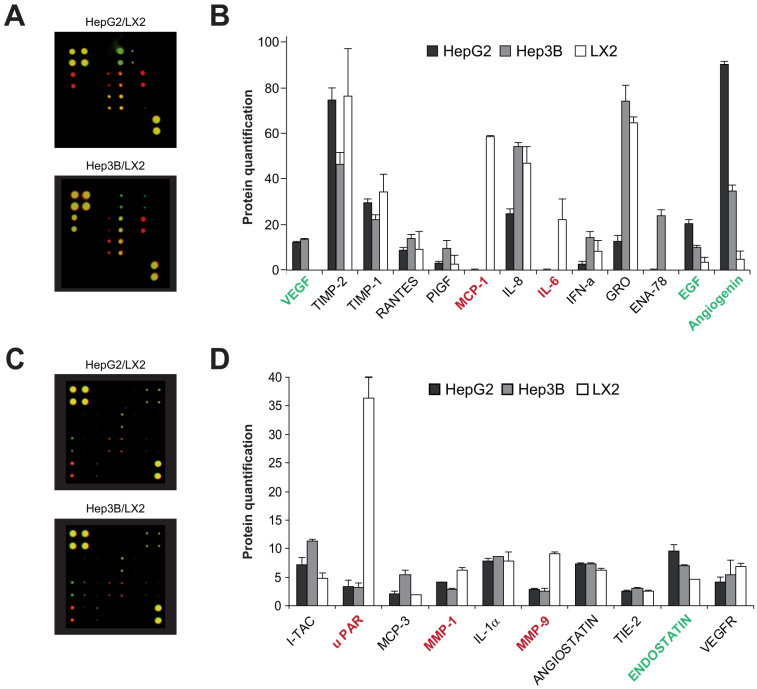
Figure 3. Differential profile of angiogenesis-related proteins in the secretome of hepatoma (HepG2 and Hep3B) and human HSC activated (LX2) cells.
A and B, Representative merged images of antibody microarrays for protein detection in conditioned medium (CM) from HepG2 or Hep3B (green) and compared to CM-LX2 (red) protein pattern. B and D, protein quantification was measured after calibration with internal standards and background controls. (n = 2). Indicated in red the proteins more expressed in LX2 respect to hepatoma cells, and in green the proteins more expressed in Hep3B/HepG2 compared to LX2.

