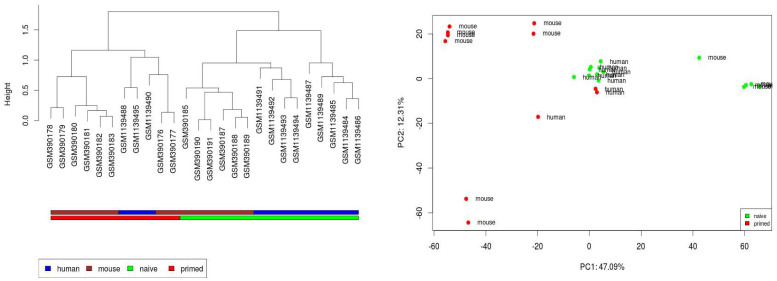
Figure 10. Analysis of the combined gene expression data set of Hanna et al. [2009]8 and Gafni et al. [2013]10.
The Hanna/Gafni data set consists of 26 microarray samples that correspond to four conditions: NH, PH, NM and PM. For the sample preprocessing and construction of the gene expression matrix, see text. A: Hierarchical clustering dendrogram of the samples (Spearman's rank correlation, complete linkage). The colour bar below the dendrogram provides information about the species (upper bar) and pluripotency state (lower bar) of the single samples. The samples are labelled with their GEO identifiers; see data sets GSE46872 and GSE15603 for details. B: Principal component analysis (PCA) of the data set. The colour of the symbols indicates the pluripotency state of the respective samples, while labels next to the symbols indicate the species.

