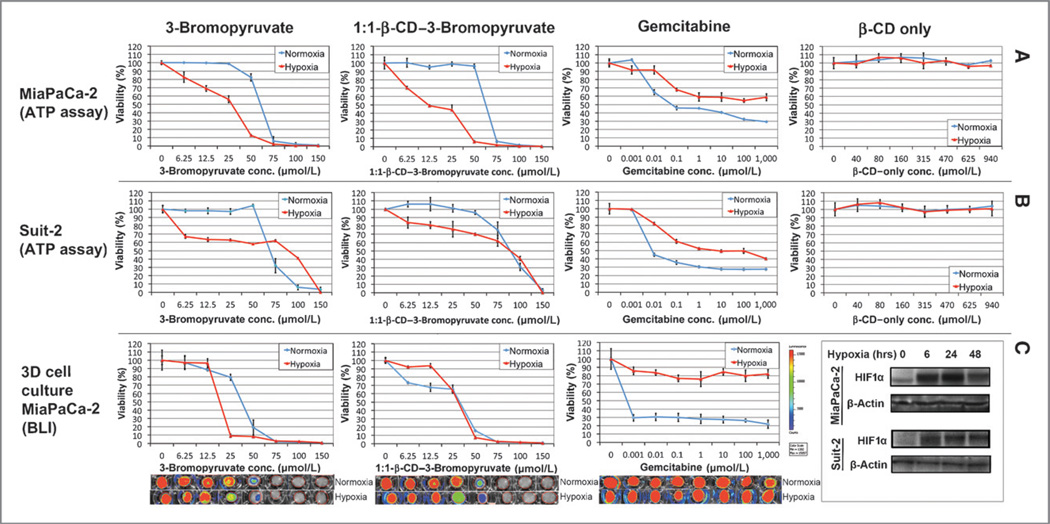
Figure 2.
Kill curves in 2D and 3D organotypic cell culture. This figure illustrates the luminescence-based cell viability of MiaPaCa-2 (A, top row) and Suit-2 (B, middle row) cells after various treatments. Cells were incubated under normoxic or hypoxic conditions for 72 hours before exposure to 3-BrPA, 1:1-β-CD–3-BrPA or β-CD for 24 hours. Cells were incubated for 24 hours before being treated with gemcitabine for 72 hours. For the 3D organotypic cell cultures (C, bottom row), lucMiaPaCa-2 cells were incubated under normoxic or hypoxic conditions for a total of 6 days; single treatments with 3-BrPA or β-CD–3-BrPA were performed on day 5 for 24 hours. Exposure to gemcitabine was initiated on day 3 for 72 hours (due to the longer time-to-effect for this drug). Bioluminescence imaging was performed on day 6 to evaluate drug penetration and effects on cell viability. The bottom right box contains the immune-blots for HIF-1α to confirm that hypoxia was present.

