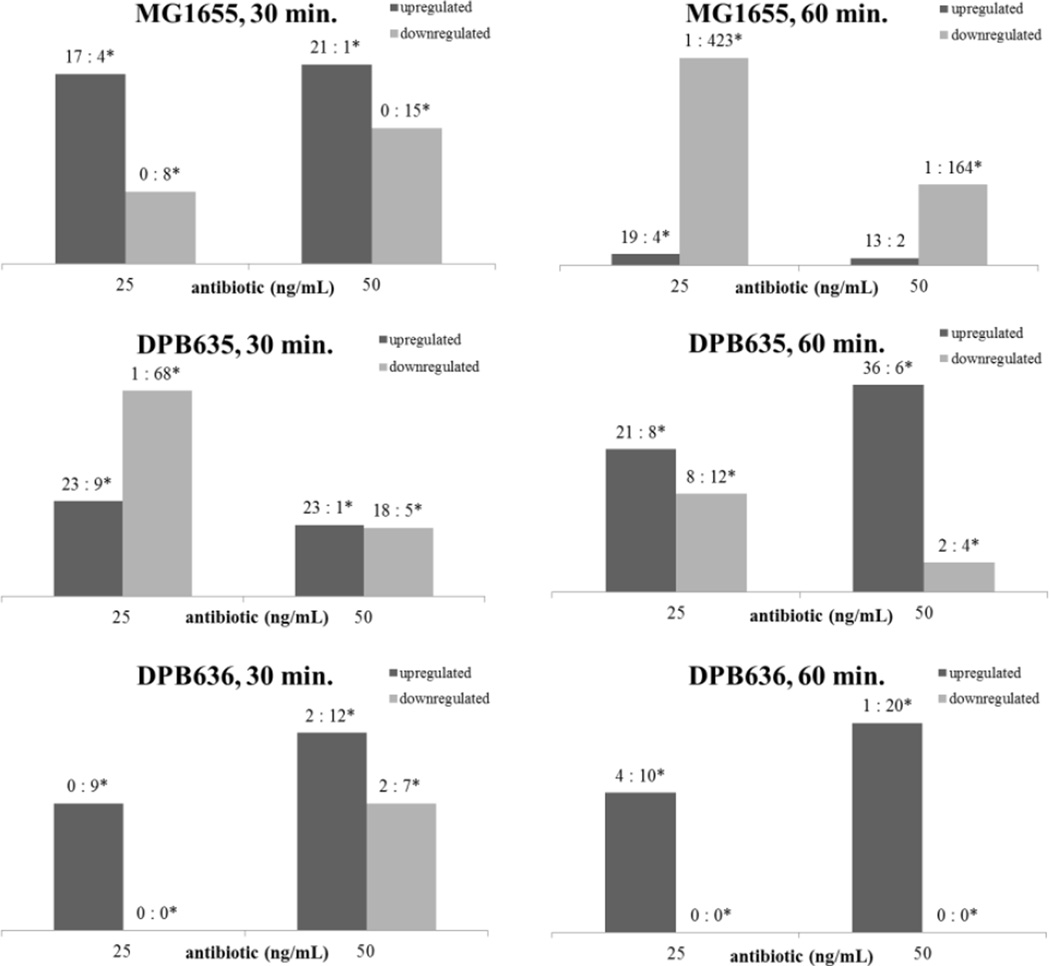
Figure 3.
Total number of lipids up or downregulated as a function of norfloxacin dose and time exposure for MG1655, DPB635 and DPB636. Values above each column correspond to the number of ↑:↑* lipids or ↓:↓* lipids for each strain and condition. The asterisk (*) corresponds to lipids that are up or down regulated on the basis of an absence (not detection).

