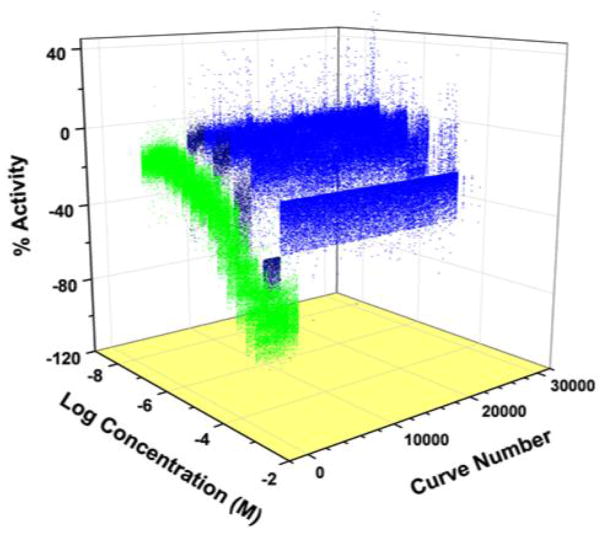
Figure 1.
Three-dimensional plot of quantitative high-throughput screen showing inhibition of the apoferritin/1-aminoanthracene interaction by propofol control (green,) top active compounds (dark blue,) and weak actives/indeterminate compounds (blue.) Top actives and weak actives/indeterminates represent 7.3% of the total compound library screened. This figure is publically available at http://www.ncbi.nlm.nih.gov/books/NBK153223/ and permission to reproduce is not required.

