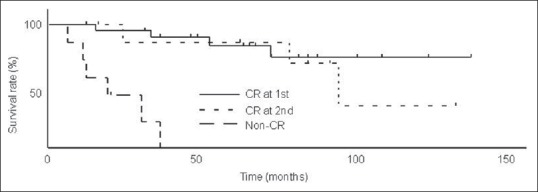
Figure 4.

Overall survival rates (OS) of complete response (CR) at the first evaluation, CR at the second evaluation and the non-CR. Five-year OS of these three groups were 82.8% (n=21), 85.3% (n=9) and 0% (n=7), respectively. Five-year OS of CR groups were significantly higher than that of non-CR group (P<0.0001, P=0.0014, respectively)
