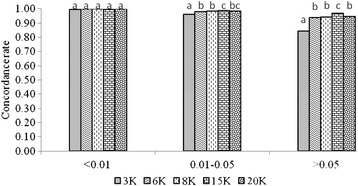
Figure 3.

Concordance rate of imputation by MAF classes. Average over scenarios of imputation from alternative low density panels (3K, 6K, 8K, 15K and 20K) to the 50K SNP panel. Within a group of colums, two different letters means a statistical difference (P < 0.05).
