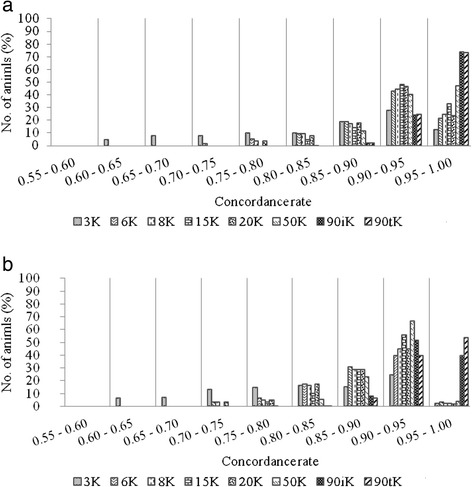
Figure 4.

Concordance rate of imputation to the 777K panel in different concordance rate bins. Average over scenarios of imputation from alternative low density panels (3K, 6K, 8K, 15K, 20K, 50K, 90iK and 90tK) to the 777K SNP panel. a) using FImpute; Please note that figures cannot be composed of text only. Since it is in a table format, please modify Figure 1 as a normal table with at least two columns. Please ensure that if there are other tables in the manuscript, affected tables and citations should be renumbered in ascending numerical order. using Beagle.
