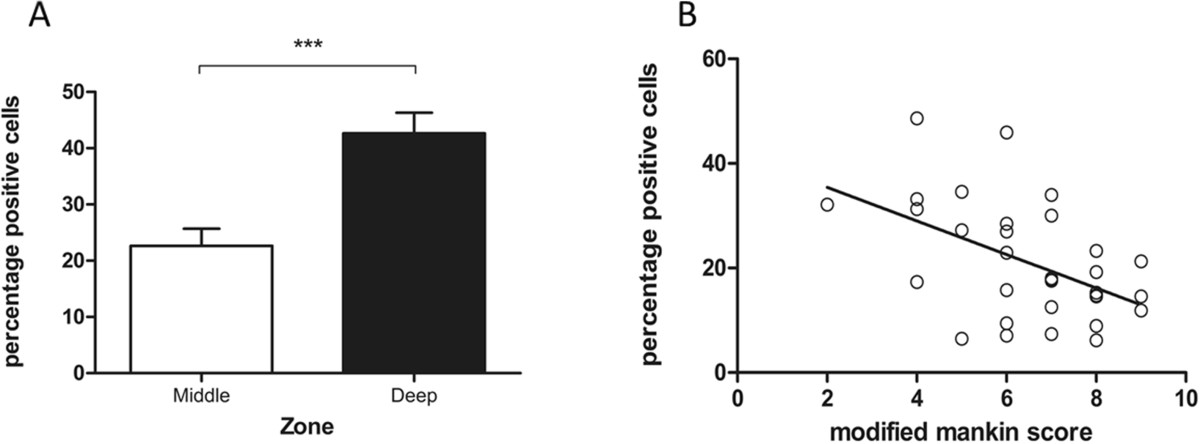
Figure 2.

Statistical analyses of immunohistochemistry staining. (A) Zonal variation in HDAC4 expression in OA cartilage. The results are expressed as mean ± SEM. (n = 17; ***P < 0.001) (B) Overall relationship between Mankin score and expression of HDAC4. The extent of HDAC4 expression decreases linearly with increasing severity of OA (n = 34, r = −0.49, P = 0.0041).
