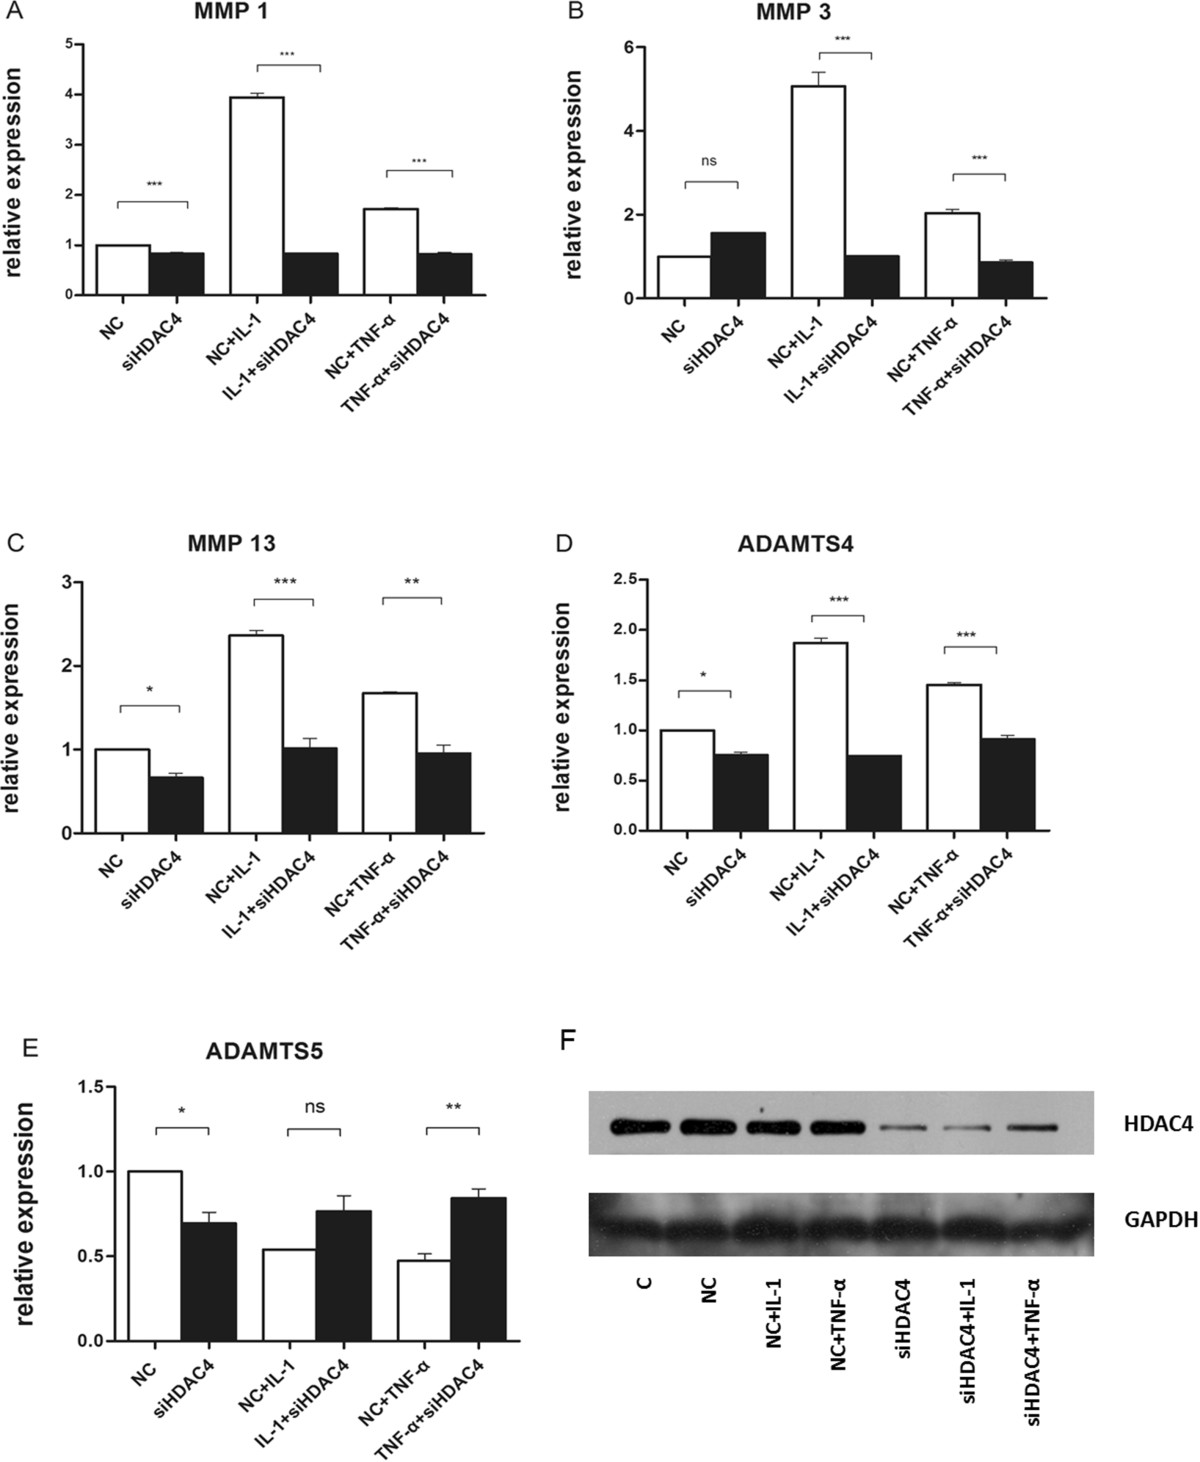
Figure 3.

Relative expression of key catabolic genes in the absence or presence of siHDAC4. Messenger RNA levels were quantified by real time RT-PCR and normalized to beta-actin. The expression levels of genes (A, B, C, D and E) were defined from the threshold cycle (Ct) and relative values were calculated by the 2-ΔΔCt method. Western blot analyses (F) were used to compare the relative levels of HDAC4 protein with and without the treatment of siRNA ( C = control, NC = negative control). Data are presented as mean ± SEM(n = 3, in duplicate). **P < 0.01 ,***P < 0.001.
