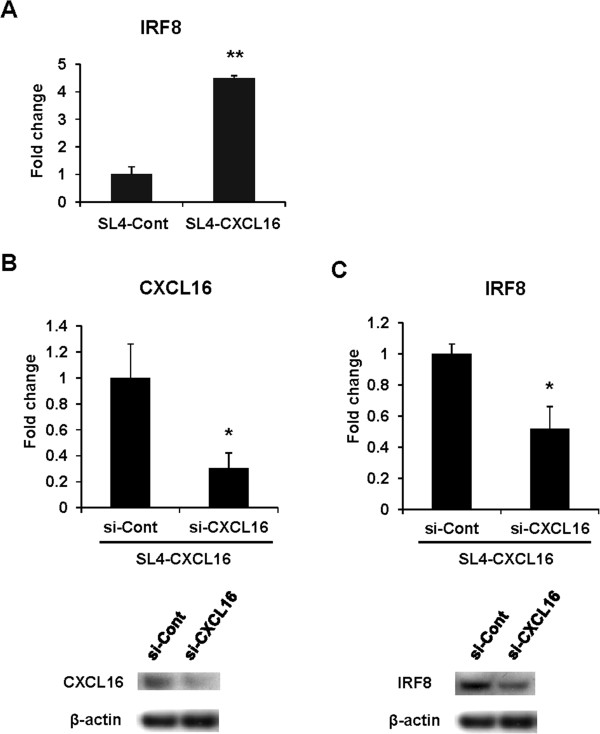
Figure 3.

Correlation of CXCL16 and IRF8 expression in SL4 cells. (A) Expression of IRF8 in SL4-Cont and SL4-CXCL16 cells cultured for 24 h and analyzed by qRT-PCR. These data were normalized to GAPDH. (B) Knockdown of CXCL16 expression. SL4-CXCL16 cells were transfected with siRNA for 36 h to assess the expression of CXCL16 at the mRNA (upper panel) and protein (lower panel) levels. (C) Expression levels of IRF8 in SL4-CXCL16 using siRNA for control and CXCL16. β-actin was used as a normalization control. *P <0.05, **P <0.01. All experiments were repeated at least three times.
