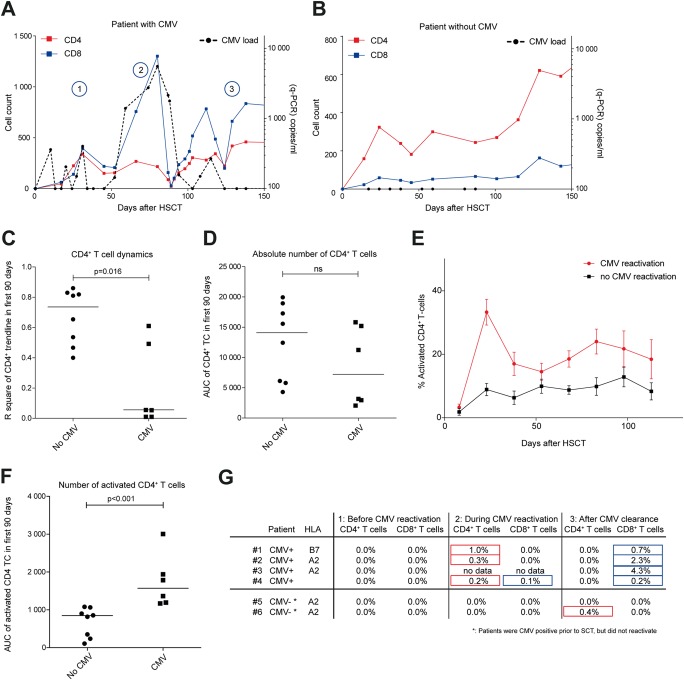
FIG 1.
T-cell dynamics in CBT recipients. (A and B) T-cell development over time in CBT recipients with (A) or without (B) CMV reactivation (load of >1,000 copies/ml). Red and blue lines represents CD4+ and CD8+ T-cell numbers, respectively (absolute counts). The black dashed line represents CMV loads (copies/ml). The numbers 1, 2, and 3 (in blue circles) correspond with referred time points in panel G. (C) CD4+ T-cell dynamics (R2 of CD4+ trendline) and median in the first 90 days after transplantation in CBT recipients without (dots) or with (squares) CMV reactivation. A high R2 indicates little fluctuation from the predicted trendline. (D) Total CD4+ T-cell numbers (area under the curve [AUC]) and median in the first 90 days after transplantation in CBT recipients without (dots) or with (squares) CMV reactivation. ns, not significant. (E) Mean percentage (+ standard error of the mean [SEM]) of activated CD4+ T cells in CBT recipients with (red line) or without (black line) CMV reactivation (average of 15 days per data point). (F) AUCs and medians of activated CD4+ T cells in the first 90 days. (G) Percentages of pp65-specific CD4+ and CD8+ T cells (tetramer and/or IFN-γ release upon pp65-peptide mix stimulation) before CMV reactivation (1), during CMV reactivation (2), and after CMV clearance to below detection limits (3) (see panel A) in 4 CBT recipients with reactivation (1 to 4) and 2 CBT recipients without reactivation (5 and 6). Red boxes, CD4+ T cells; blue boxes, CD8+ T cells (corresponding to panels A and B). No samples were available during CMV reactivation for patient 3. Significance in panels C, D, and F was determined using a nonparametric Mann-Whitney test.

