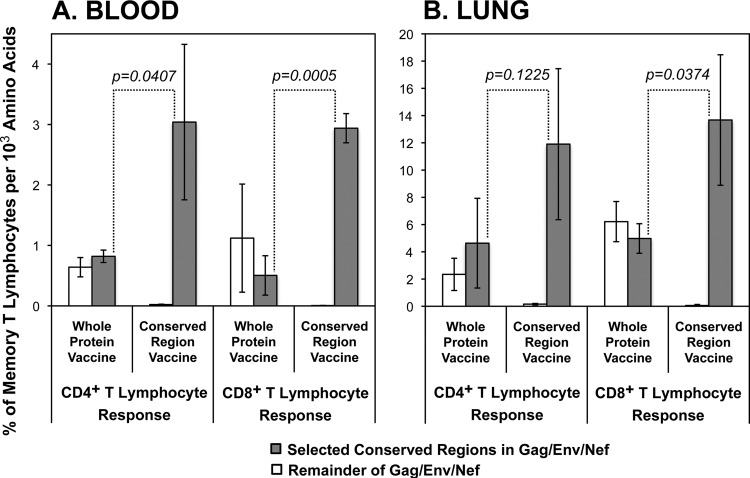
FIG 5.
Comparison of targeting against selected conserved regions of Gag, Env, and Nef versus outside regions after vaccination with WPV versus CRV at the peak after rAd5 boost. The peak responses at day 182 were plotted as means ± standard deviations for each group of three animals, according to the targeting densities plotted in Fig. 4. The significances of differences between targeting levels of conserved regions between the two vaccines are indicated (Student's t test).

