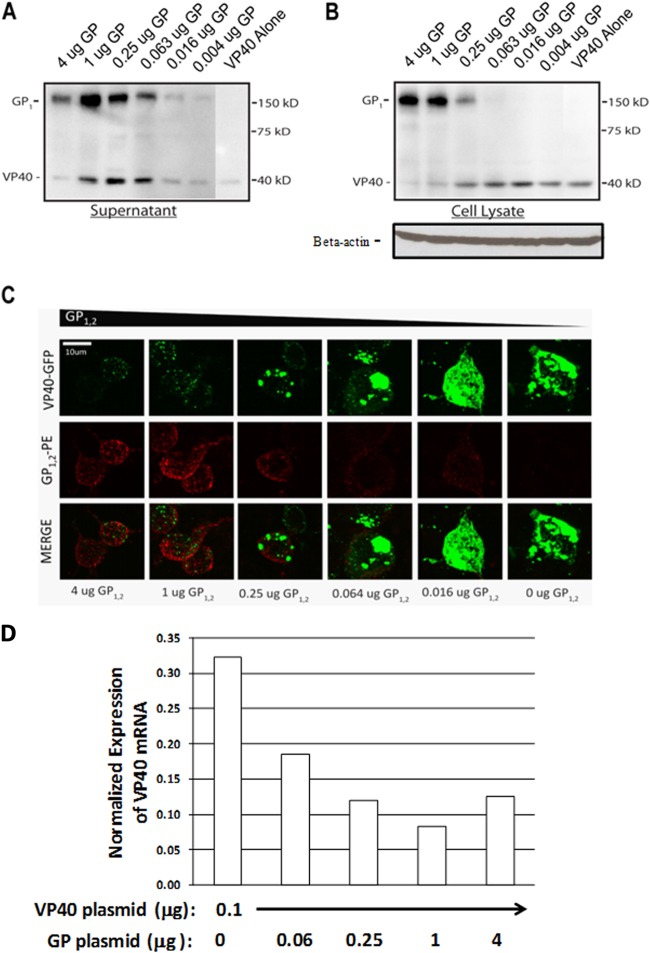
FIG 4.
High levels of GP1,2 expression impair EBOV VLP production. (A, B) Production of EBOV VLPs with various GP1,2 expression levels. 293T cells were transfected with 100 ng of EBOV VP40 DNA plus various amounts of GP1,2 DNA (4 μg to 4 ng). Supernatant (A) and cell lysate (B) were assayed by Western blotting at 48 h posttransfection using polyclonal rabbit antiserum recognizing all Zaire EBOV proteins (tops of panels) or a mouse monoclonal antibody against β-actin (bottom of panel B). (C) Fluorescence microscopy of EBOV VLP-producing cells. 293T cells were transfected with 100 ng of VP40-GFP fusion protein DNA, plus various amounts of GP1,2 DNA (4 μg to 16 ng). At 48 h posttransfection, cells were fixed and stained for GP1,2 using mouse anti-GP1,2 immune sera, followed by a PE-conjugated anti-mouse antibody. Cells were then visualized by fluorescence microscopy for GP1,2 (PE, in red) and VP40 (GFP, in green). Scale bar, 10 μm. (D) Coexpression of GP1,2 reduces VP40 mRNA levels. 293T cells were transfected with VP40 DNA and GP1,2 DNA at the amounts indicated along the x axis. At 48 h following transfection, steady-state levels of VP40 mRNA were measured using quantitative real-time RT-PCR. The y axis represents normalized expression levels of VP40 relative to GAPDH. The results from one of two independent experiments are shown.

