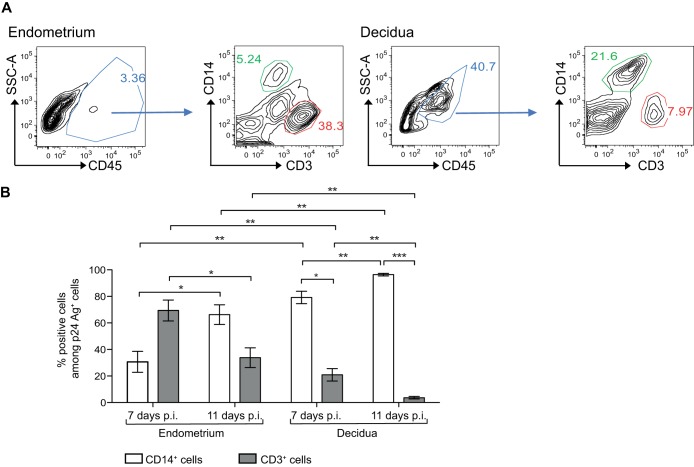
FIG 2.
Percentage of CD14+ cells and CD3+ cells among endometrial and decidual HIV-1-infected cells. (A) Flow cytometry graphs show the gating strategy for the identification of CD14+ cells (green gate) and CD3+ cells (red gate). (B) Endometrial and decidual mononuclear cells were exposed to HIV-1BaL at an MOI of 10−3. Intracellular staining of the p24 Ag was performed on days 7 and 11 postinfection (p.i.). The mean percentages of CD14+ cells or CD3+ cells among p24 Ag+ cells are displayed (n = 5 on day 7 and n = 7 on day 11 for the endometrium; n = 6 on day 7 and n = 11 on day 11 for the decidua). Bars indicate standard errors of the means. *, P < 0.05; **, P < 0.005.

